The Semantic Layer: How We Define and Calculate Every Metric
Every metric we report, defined once and calculated the same way for every building. The definitions live in tested code and read from the systems you already run.
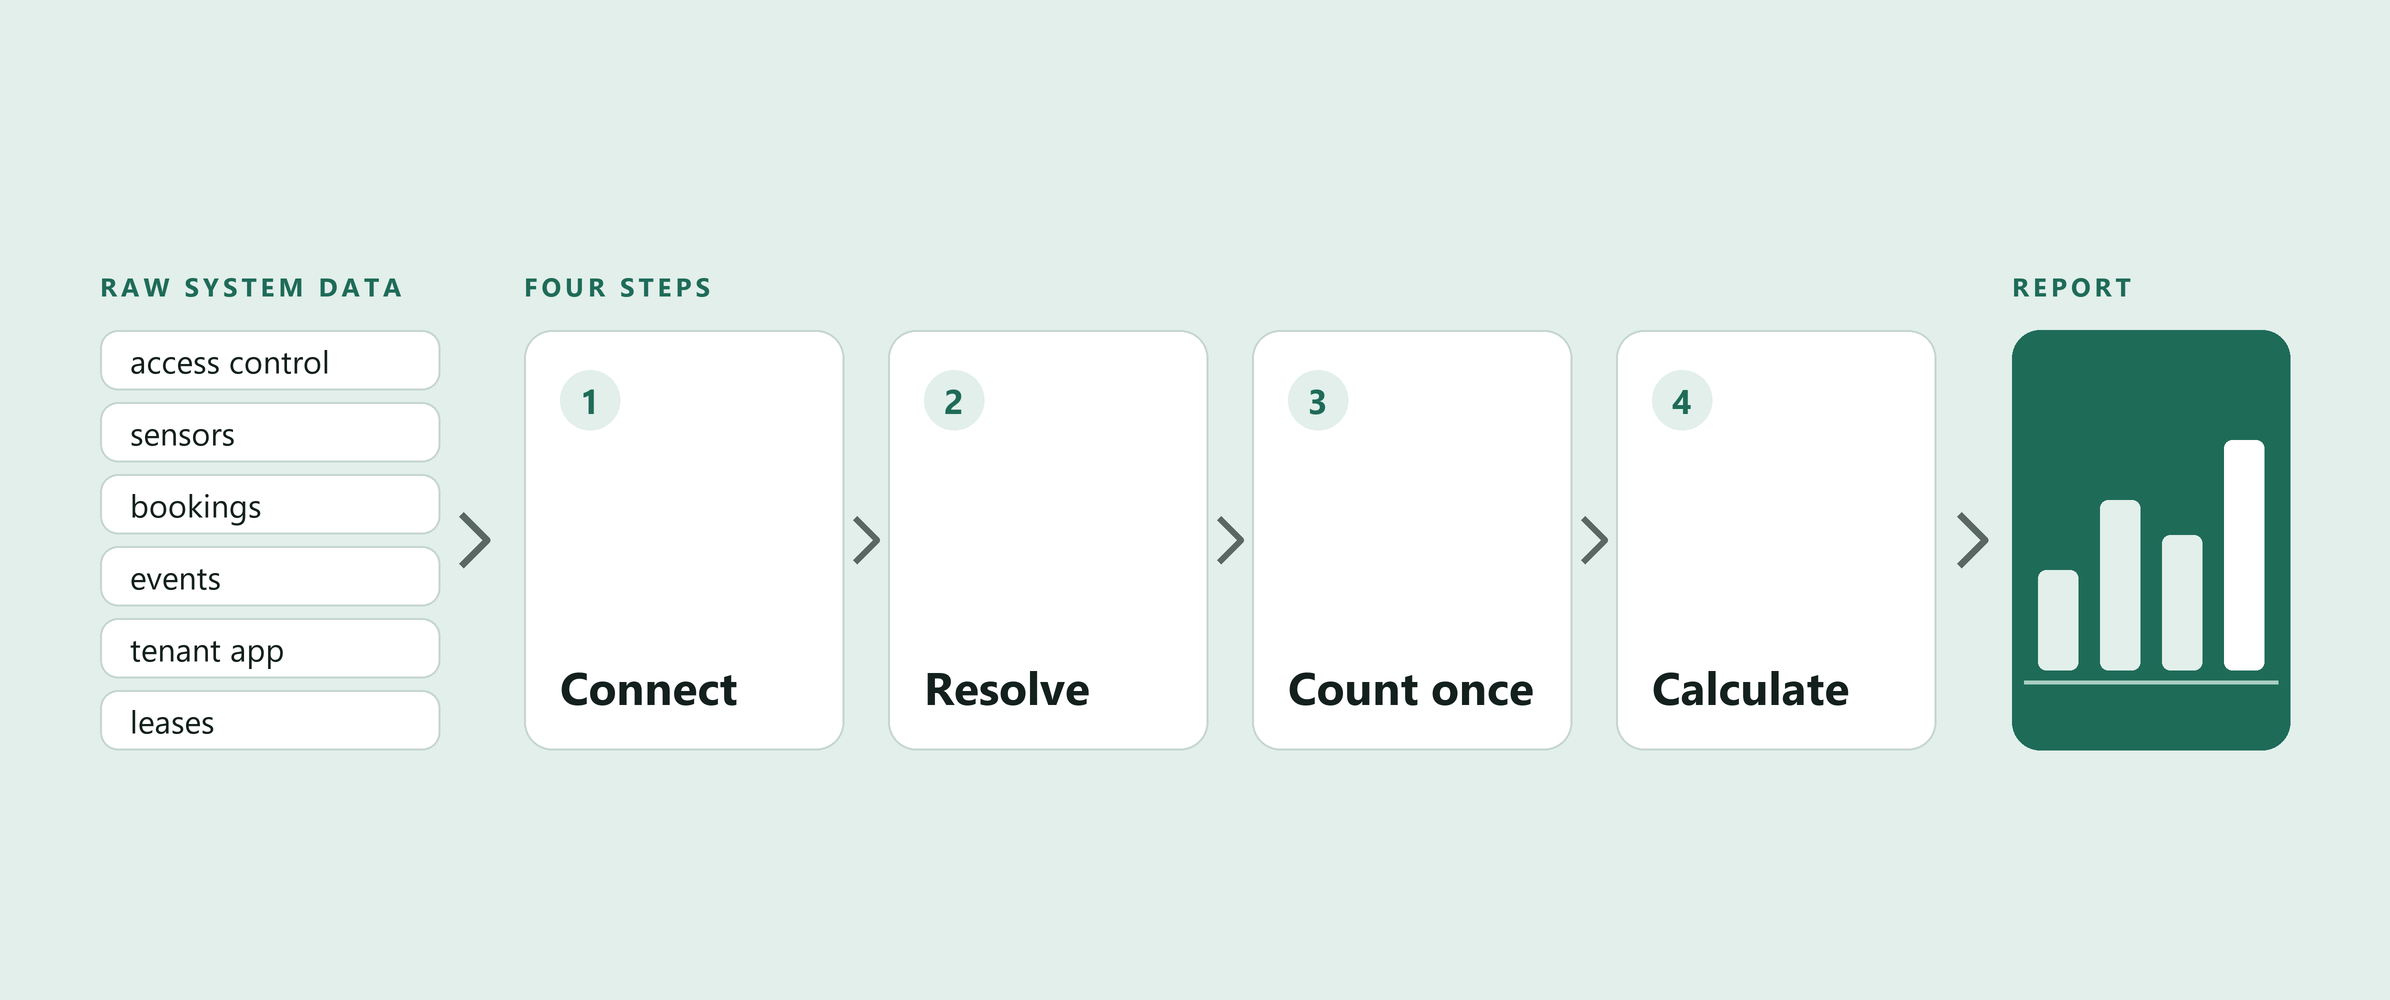
How a number is made
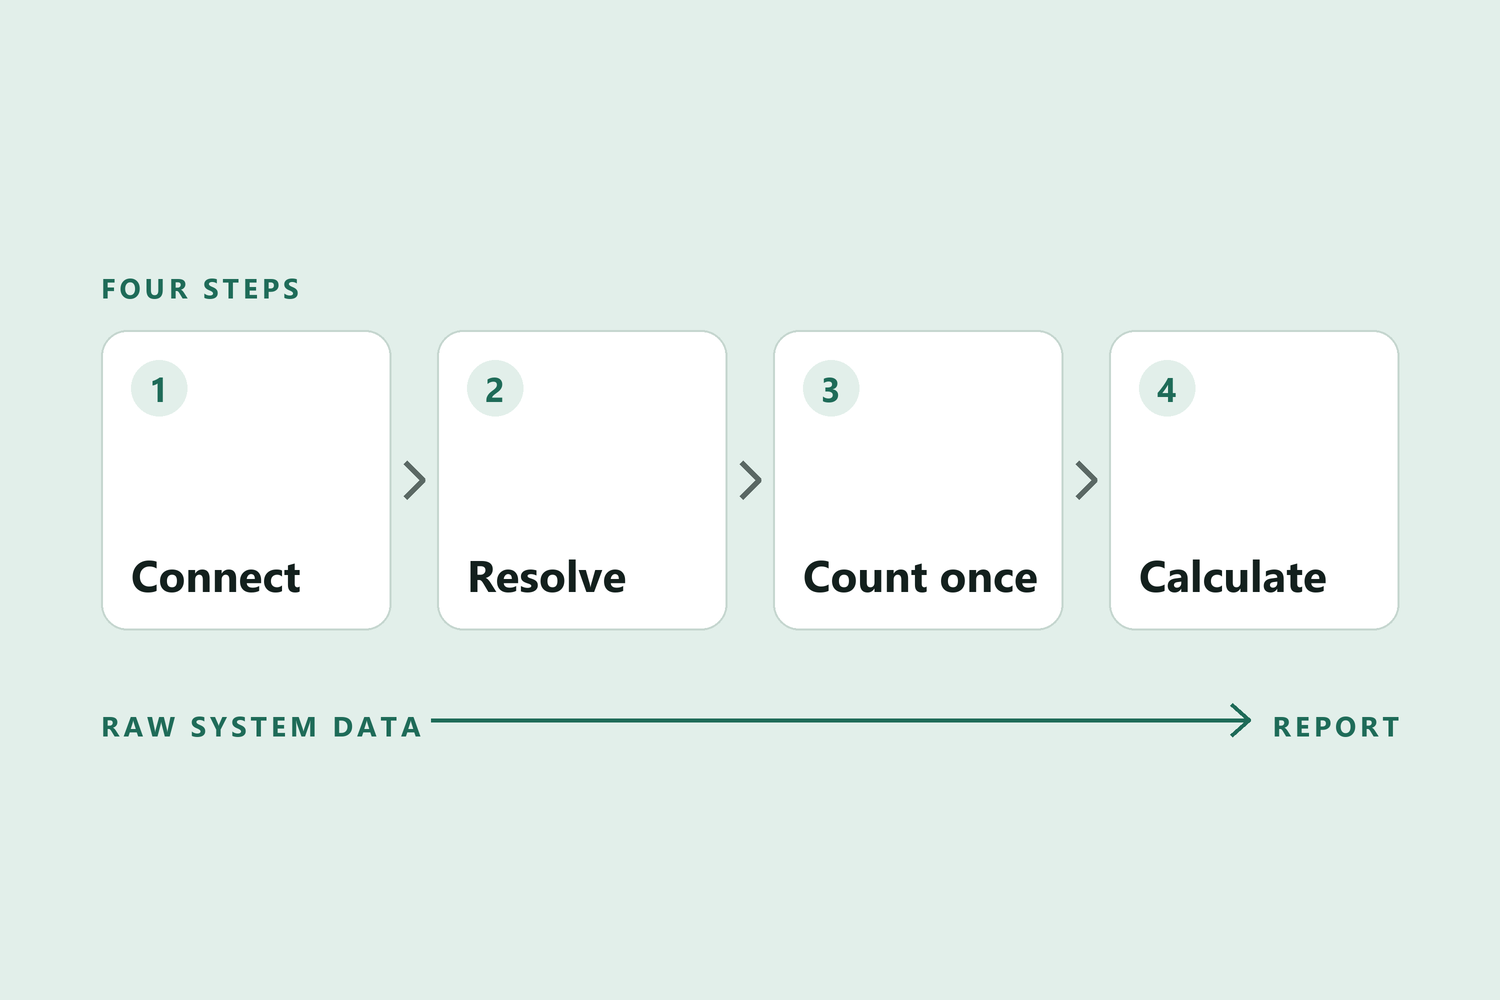
Raw system data goes through four steps before it reaches a report.
- ConnectRead each system where it lives: access control, sensors, bookings, events, tenant app, leases.
- ResolveMatch every name to a tenant on the lease and every badge, email or account to one person.
- Count onceCollapse swipes and scans into entry days: one person, one building, one local day.
- CalculateApply the formulas below, which are tested on every build.
Occupancy, five ways
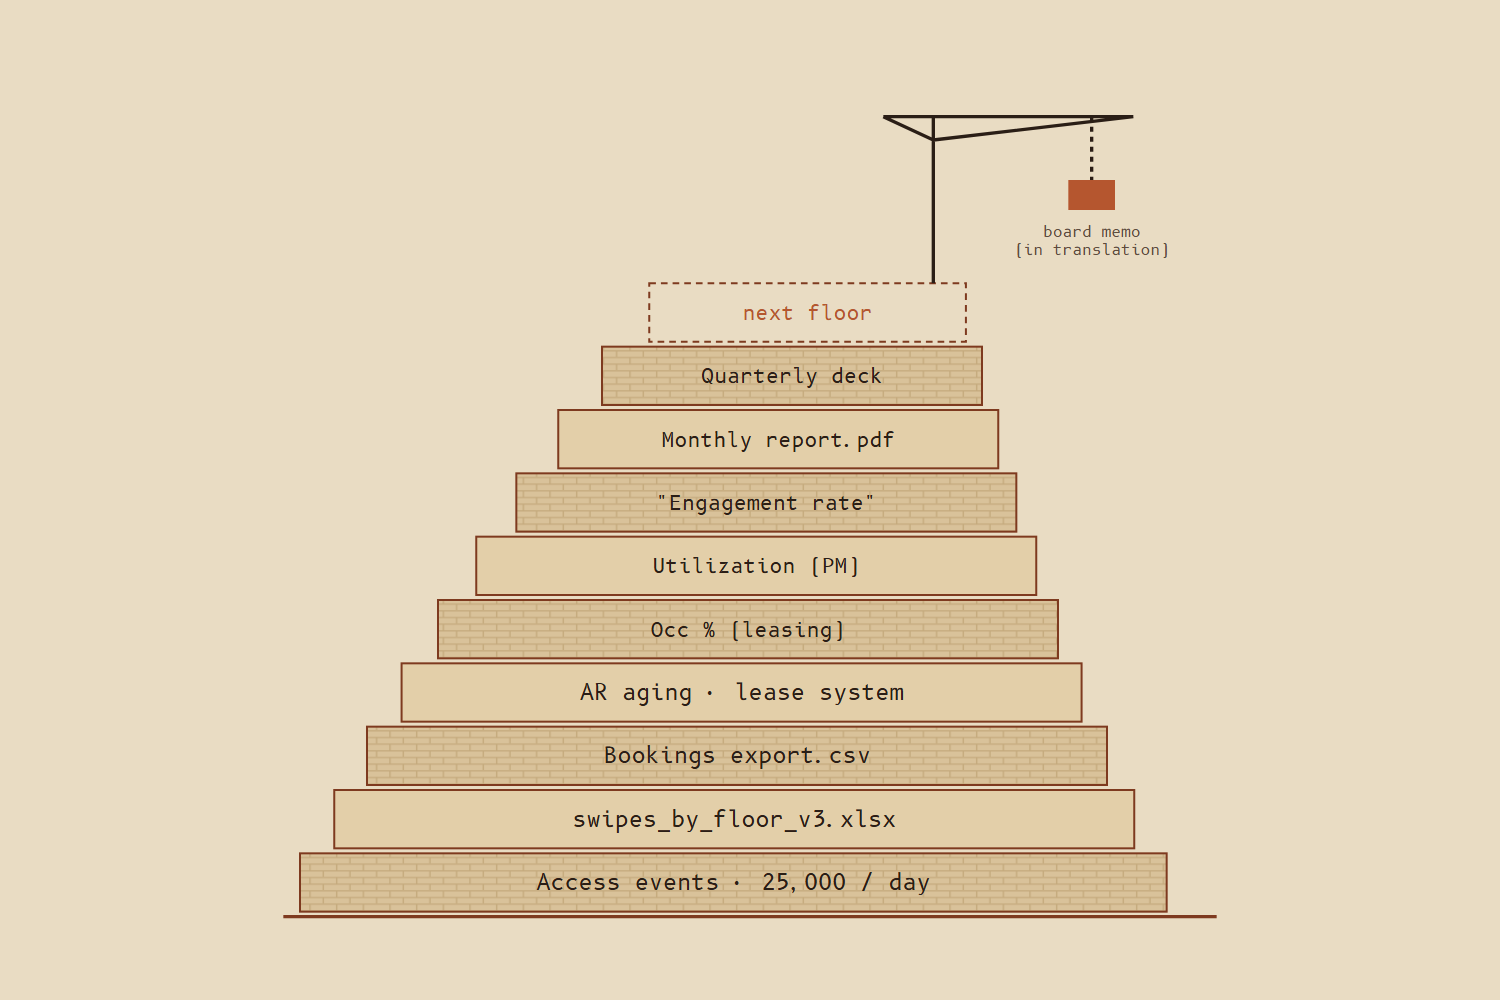
"Occupancy" means five different things across teams. Each meaning gets its own term.
| When a team says occupancy | Term | Calculation |
|---|---|---|
| Leasing: square feet leased | Leased % | leased area ÷ rentable area |
| Property management: suites moved in | Customers | organizations with an active lease |
| Finance: tenants paying rent | Annual rent | Σ rentable area × rent rate |
| Access control: people who came in | Daily occupancy | distinct people present that weekday |
| Sensors: seats in use | Utilization | avg daily occupancy ÷ capacity |
Foundations
The building blocks every other metric is made from.
One person, linked to their organization and to every identifier a system holds for them: badge, email, app account, booking login.
One person at one building on one local day with at least one recorded entry.
1 per person × building × dayOne interaction with a building program: a booking, an event check-in, a fitness visit, a tenant-app action.
The one system each building treats as authoritative for a kind of data.
The last twelve complete months.
Attendance
Who comes to the building, and how often.
Distinct people from office tenants in the building on a weekday.
entry days on the date, primary sourceDistinct people who came to the building during the period.
people with ≥ 1 entry dayA tenant’s highest daily occupancy in the period.
max(daily occupancy)How many days a week the average active person comes in.
entry days ÷ active profiles ÷ weeksEach active person in one band by their own days per week: Intermittent (< 0.5), 1, 2, 3, 4, or 5 days (≥ 4.5).
Leasing
What is under lease and what it earns.
Share of the asset’s rentable area under an active lease.
leased area ÷ rentable areaOrganizations holding at least one active lease.
distinct organizations with an active leaseAnnual rent across active leases.
Σ rentable area × rent rateAverage remaining lease term in years, weighted by rent.
Σ(years remaining × annual rent) ÷ total annual rentSpace efficiency
How well leased space fits the people who use it.
People a leased space is designed to hold at once.
Planned area per person, set per lease.
Share of capacity in use on a typical day and on the busiest day.
avg daily occupancy ÷ capacity · peak occupancy ÷ capacityArea needed on the busiest day, with 15% headroom.
peak occupancy × target density × 1.15Projected need compared with what is leased.
projected area ÷ rentable areaAnnual rent carried for space the busiest day didn’t use.
annual rent − (min(peak, capacity) × rent rate × target density)Program engagement
Who uses amenities, events and the tenant app.
People who used at least one program and were present in the same period.
Share of people in the building who used a program.
engaged profiles ÷ active profilesHow often engaged people engaged.
touchpoints ÷ engaged profilesOf last month’s engaged people, the share who engaged again.
engaged both months ÷ engaged last monthShare of people in the building holding a tenant-app account.
app account holders ÷ active profiles (T12)Amenity bookings
Supply and demand for bookable rooms and events.
Hours a space is on sale under the building’s declared booking window.
Time a space was held, overlapping bookings merged.
Share of sellable time that was booked.
in-window booked hours ÷ bookable hoursShare of sellable days with any booking.
booked days ÷ bookable daysA divisible room and its halves count as one piece of supply.
More than one booking on a room at the same moment.
How full events got against their RSVP limit.
roster ÷ RSVP limit, events with a limitRules every metric follows
Enforced in code. A number that breaks one fails the build.
- Headcount comes from entries. A badge on file is not a person.
- One person, once per day, however many systems saw them.
- Days follow the building's time zone, not UTC.
- Only fulfilled interactions count. An RSVP or a booking alone is intent.
- Empty rates are blank, not zero. No data and no engagement are different facts.
- Every figure states its window: month or trailing 12 months.
- Unlike things are never summed, such as bookings plus fitness visits.
- Physical space is counted once, however many ways it's sold.
Does your team use a term this page doesn't cover, or define one differently?
Talk to us