Greetings From Your Building
The monthly report is a postcard. It's time to go see the place yourself.
For this Whiteboard, we thought we'd have a little fun. Hope you enjoy!
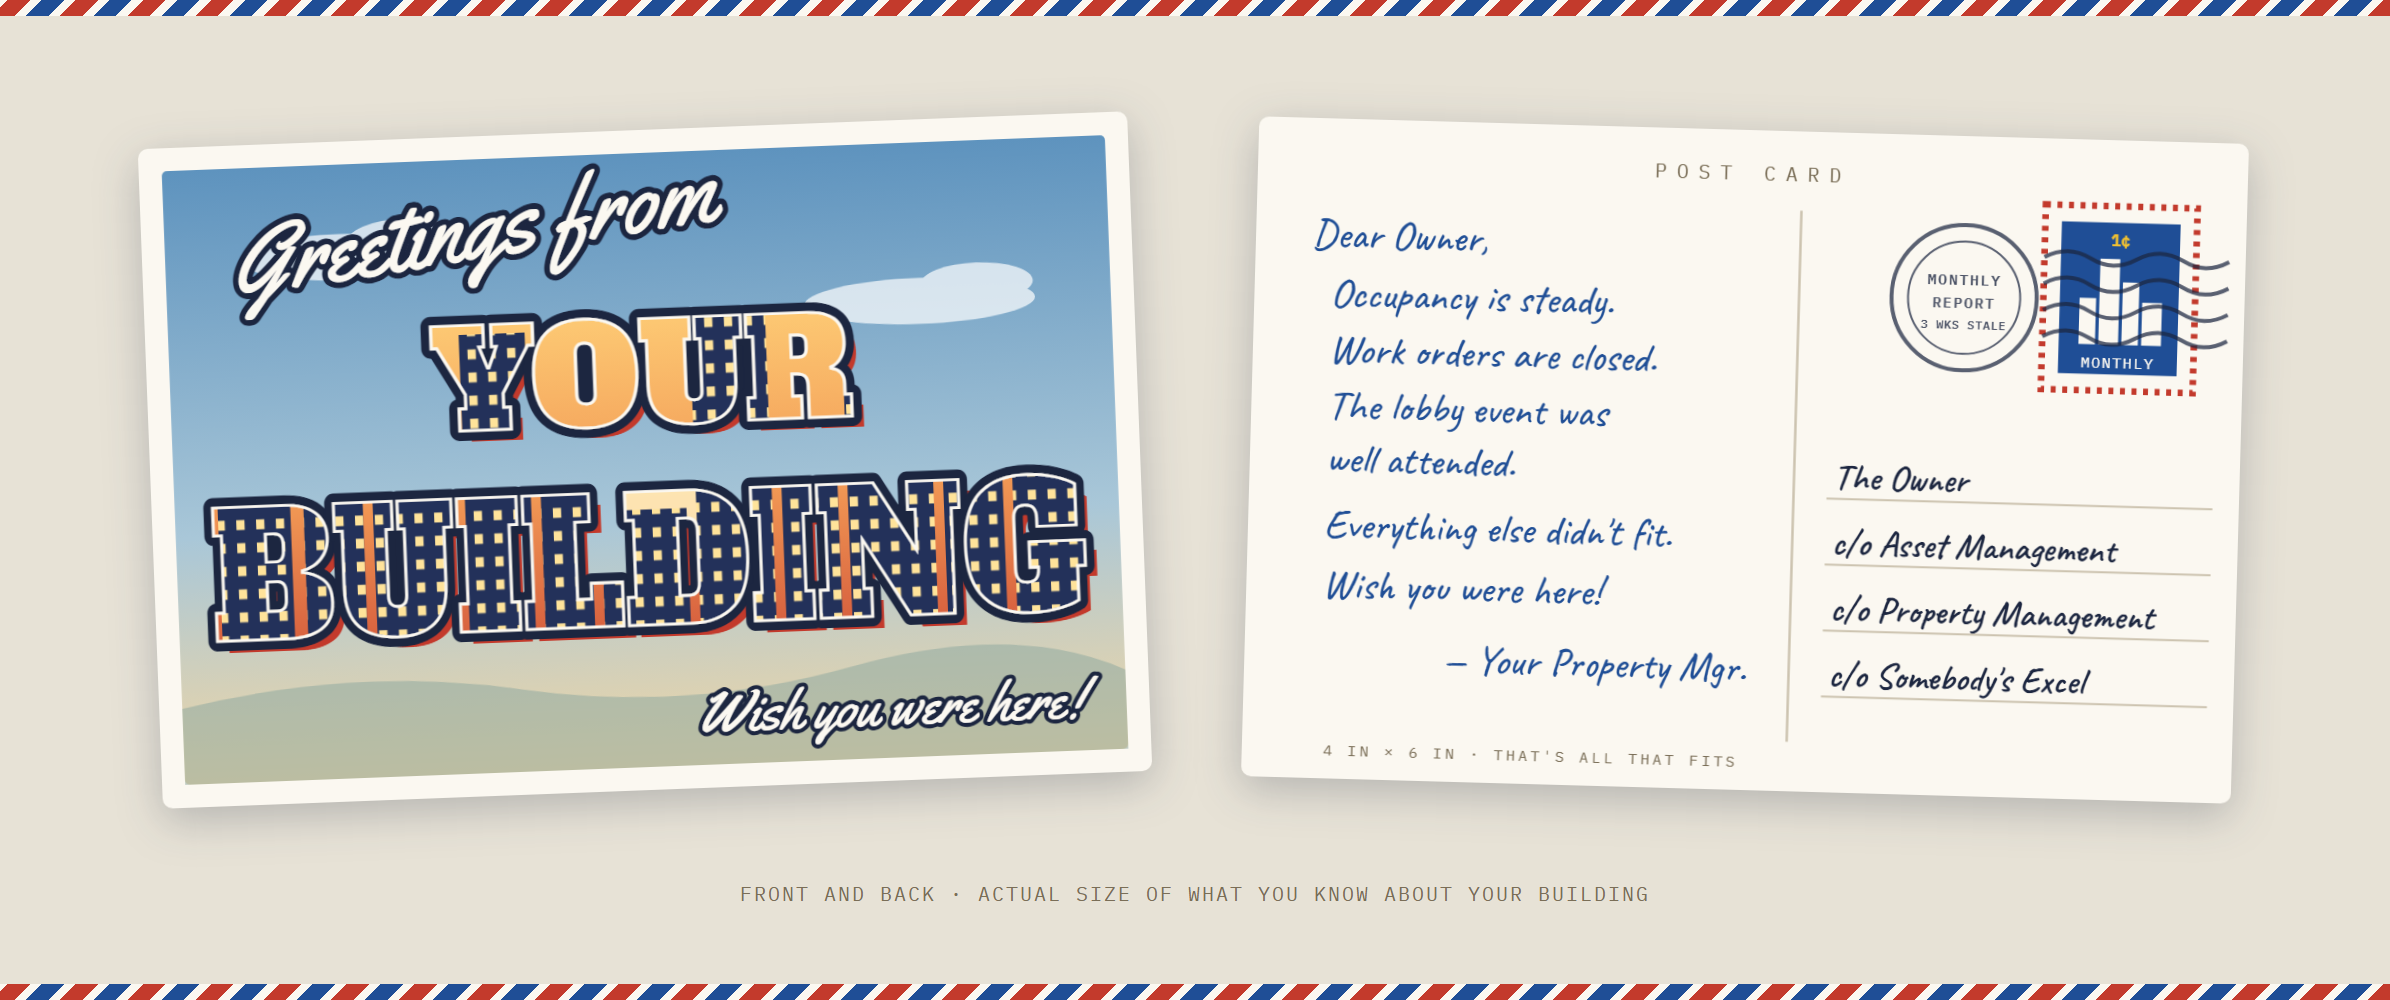
Every month, your building sends you a postcard.
It's a nice one. Occupancy is steady. Work orders are closed. The lobby event was "well attended." Wish you were here.
But like every postcard, it's limited by the 4-inch-by-6-inch stationery it was printed on. Someone else picked the angle. Someone else decided what made the cut. And by the time it lands on your desk, it's already weeks old.
You own the building. You're getting its news by mail.
How the Postcard Gets Written
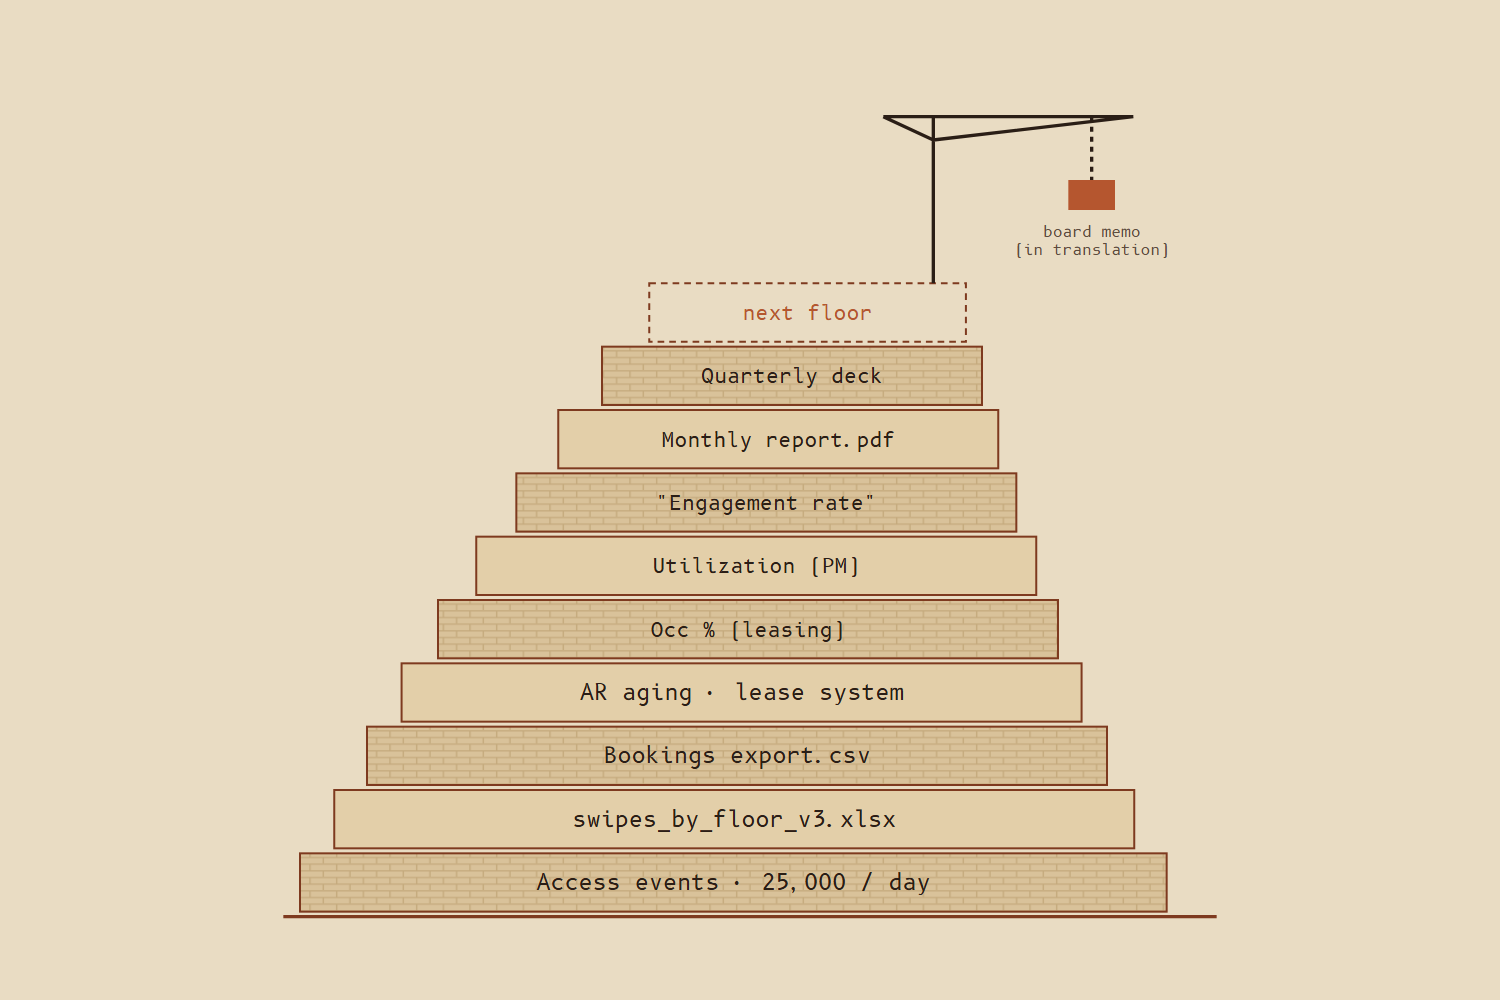
Much of commercial real estate runs on outsourcing. Property management, leasing, engineering, security, parking and amenities are either hired out to third parties or run by in-house teams, and each one runs its own systems and keeps its own data.
So your data gets partitioned:
- By contract, when a vendor owns the system.
- By obscurity, when an in-house team owns a spreadsheet only they understand.
- Usually both.
Then once a month, every team reports upstream in a standard format, summarized. Every summary is written for the benefit of the summarizer.
Nobody puts the rain on the postcard.
The Round Trip
Now ask a question the postcard doesn't answer.
Which tenants are actually using their space?
The question goes down the chain: owner to asset manager, asset manager to property manager, property manager to site team, site team to vendor. It loses a little context at every hop. Someone at the bottom exports a CSV, builds a custom Excel workbook, and sends it back up the same chain.
Days go by, sometimes weeks. And when the answer finally arrives, it answers a slightly different question than the one you asked.
- Day 0OwnerWhich tenants are actually using their space?
- Day 3Asset managerCan we get tenant usage for the portfolio review?
- Day 6Property managerOwner wants occupancy numbers again.
- Day 9Site teamNeed badge counts, whenever you get a sec.
- Day 12VendorPulling a Q3 swipe export. Excel OK?
| Floor | Swipes | Notes |
| 07 | #REF! | excl. contractors |
| 08 | see tab 3 | Sept partial |
| 10 | -- | ask Mike |
different question
Time to answer
The Questions Nobody Asks
Here's the real cost, and it isn't slow answers.
It's that owners learn. After enough round trips, you stop asking. Every question costs two weeks and somebody's goodwill, so you save them for emergencies. The postcard quietly becomes the boundary of your curiosity.
What gets reported becomes what gets managed.
And usually nobody in the chain is in a hurry to fix it. Every link gets paid to be a link. The asymmetry isn't a bug in the system. It is the system.
499,950 records a month never reach you.
AI Can't Read a Postcard
This is where the legacy gets expensive.
Everyone wants AI. But AI is only as good as the data it can reach, and in this industry that data is a PDF of a summary of a spreadsheet of an export. Point a model at that and you don't get insight. You get confident fiction, faster.
The firms that win the next decade won't be the ones with the slickest chatbot. They'll be the ones who took back their raw data first, so there's something real for the machine to think with.
The industry isn't behind on AI because it lacks tools. It spent thirty years building a business model around not knowing.
Go There Yourself
The good news: you don't need new hardware, a new vendor stack, or a five-year transformation roadmap.
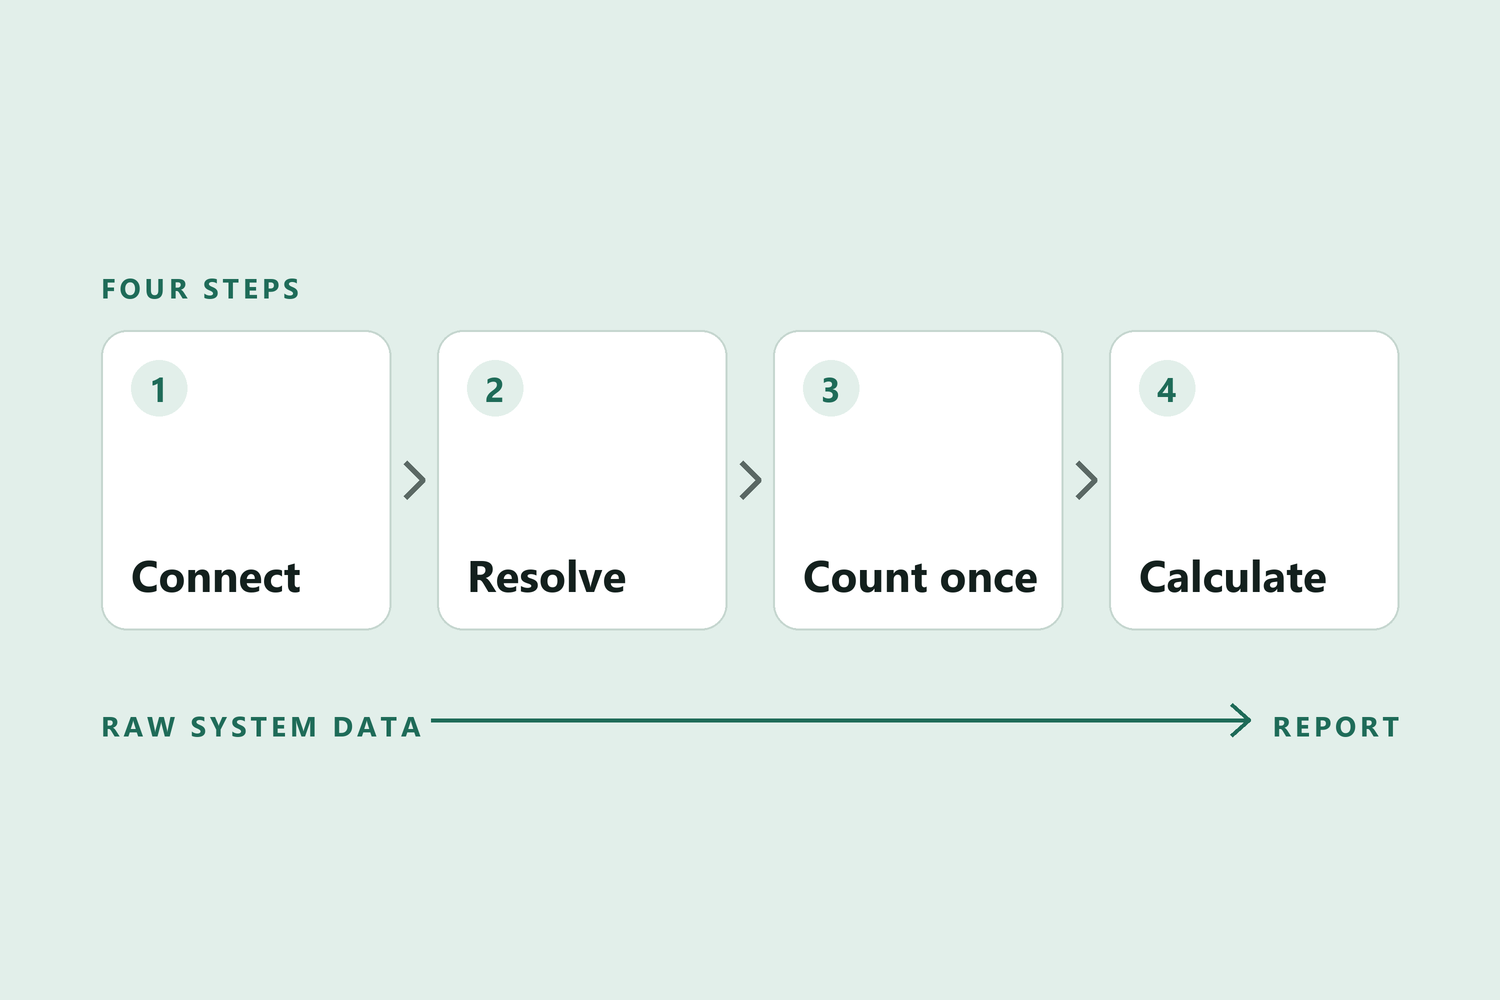
Your building is already talking. Access control, Wi-Fi, bookings, point of sale, work orders and sensors all record what's happening, every day. The fix isn't a better monthly report. It's direct lines: owner-controlled feeds, connected in one place, that you can question yourself.
Ask the question and get the answer in seconds, with the context intact and no email chain.
Work orders: closed.
Event: well attended.
Three bullets. Three weeks old. Written by the vendor.
Occupancy
By tenant, by day. Tuesdays packed, Fridays a ghost town.
Postcard said "steady"Work orders
Time to close, by tenant, and who quietly stopped submitting.
Postcard said "closed"Events
Which tenants came, and which ones never have.
Postcard said "well attended"Space vs. lease
Tenants using far less space than they pay for, years before renewal.
Not on the postcardUnknown badges
People in your building who don't match any tenant on file.
Not on the postcardRenewal signals
Risk flags from behavior, not from the lease abstract.
Not on the postcardThey're nice to have. Just stop mistaking them for the view.