Tenant Experience & Hospitality Case Study: Proving the ROI of Tenant Experience
How a progressive Class A office owner worked with REKalibrate to measure, attribute, and underwrite the return on workplace experience across three Class A assets in 2025.

How a progressive Class A office owner worked with REKalibrate to measure, attribute, and underwrite the return on workplace experience across three Class A assets in 2025.
The Office Market Has Bifurcated
Source: CBRE 2025 Occupier Sentiment Survey; CBRE 2025 Office Overview & Outlook.
Owners are investing millions in Tenant Experience. Nobody knows if it's working.
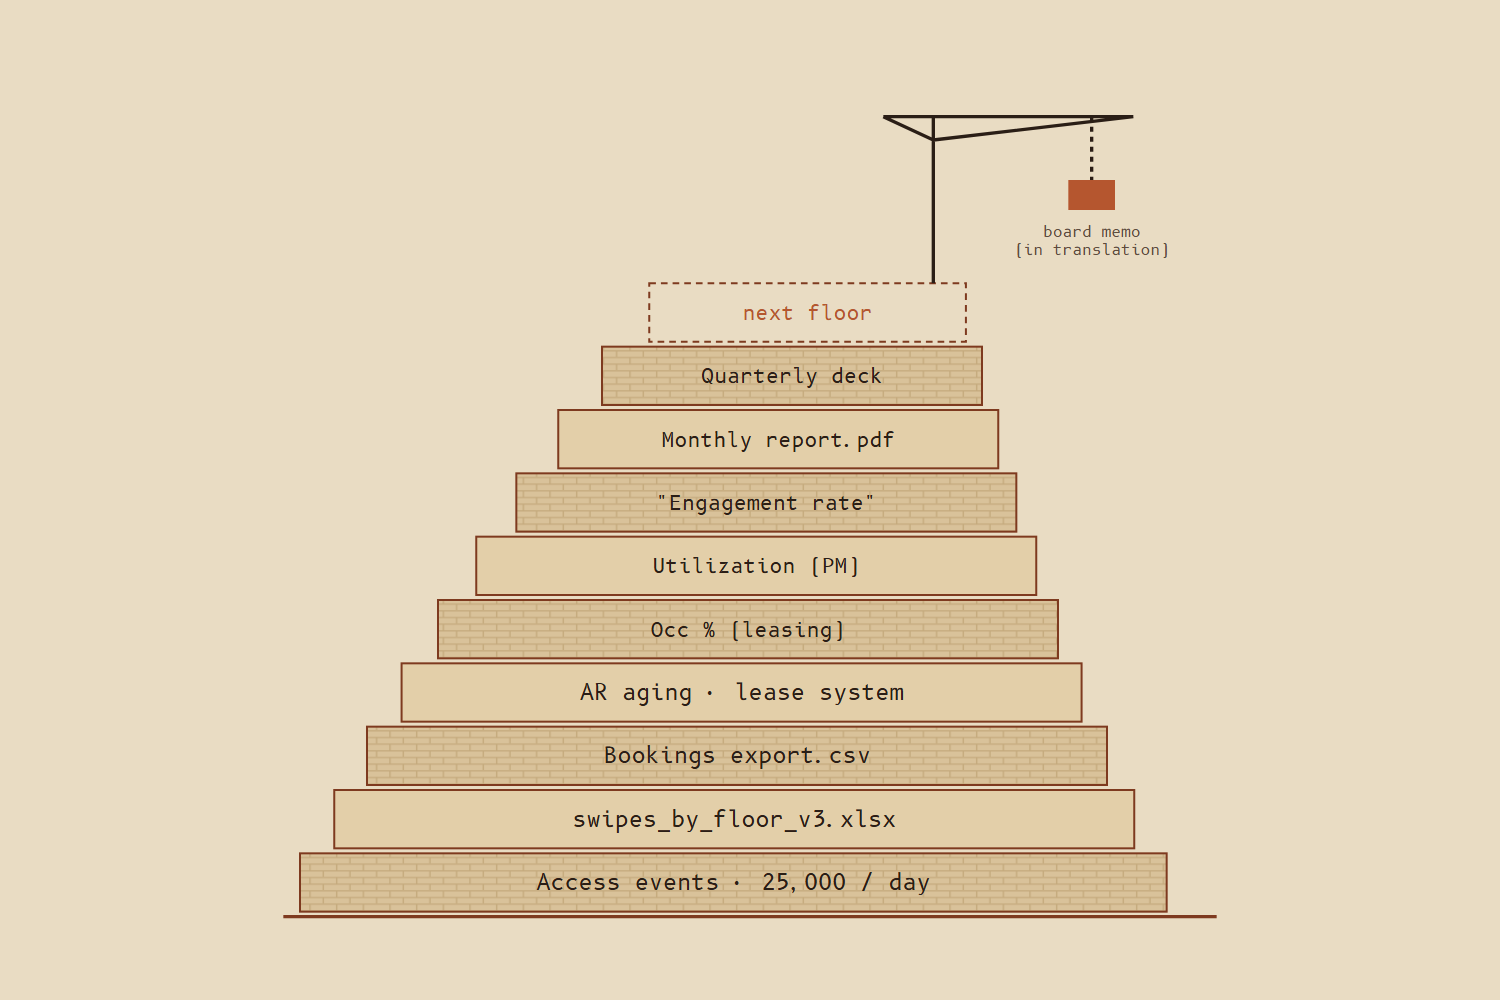
The industry has operated on intuition, not data. Owners renovate amenity floors, hire hospitality staff, and deploy technology, then wait to see if rents hold and tenants renew.
By the time the lease event arrives, the decision was made months or years earlier.
First, the owner invested in the workplace itself
The owner built a proprietary, work-forward, hospitality-inspired operating program delivered through four levers, then deployed it across its portfolio.
Spaces
Purpose-built lounges, conferencing, fitness, and F&B venues made for daily use.
People
Trained hospitality professionals layered on top of the Class A management team.
Services
Bespoke in-suite and amenity services; events anchored in community and productivity.
Technology
Integrated booking, access, F&B, and engagement apps that lower friction and generate data.
The intelligence layer between investment and outcome
The owner brought in REKalibrate to answer the question owners have never been able to: how does investment in amenities actually correlate to building performance?
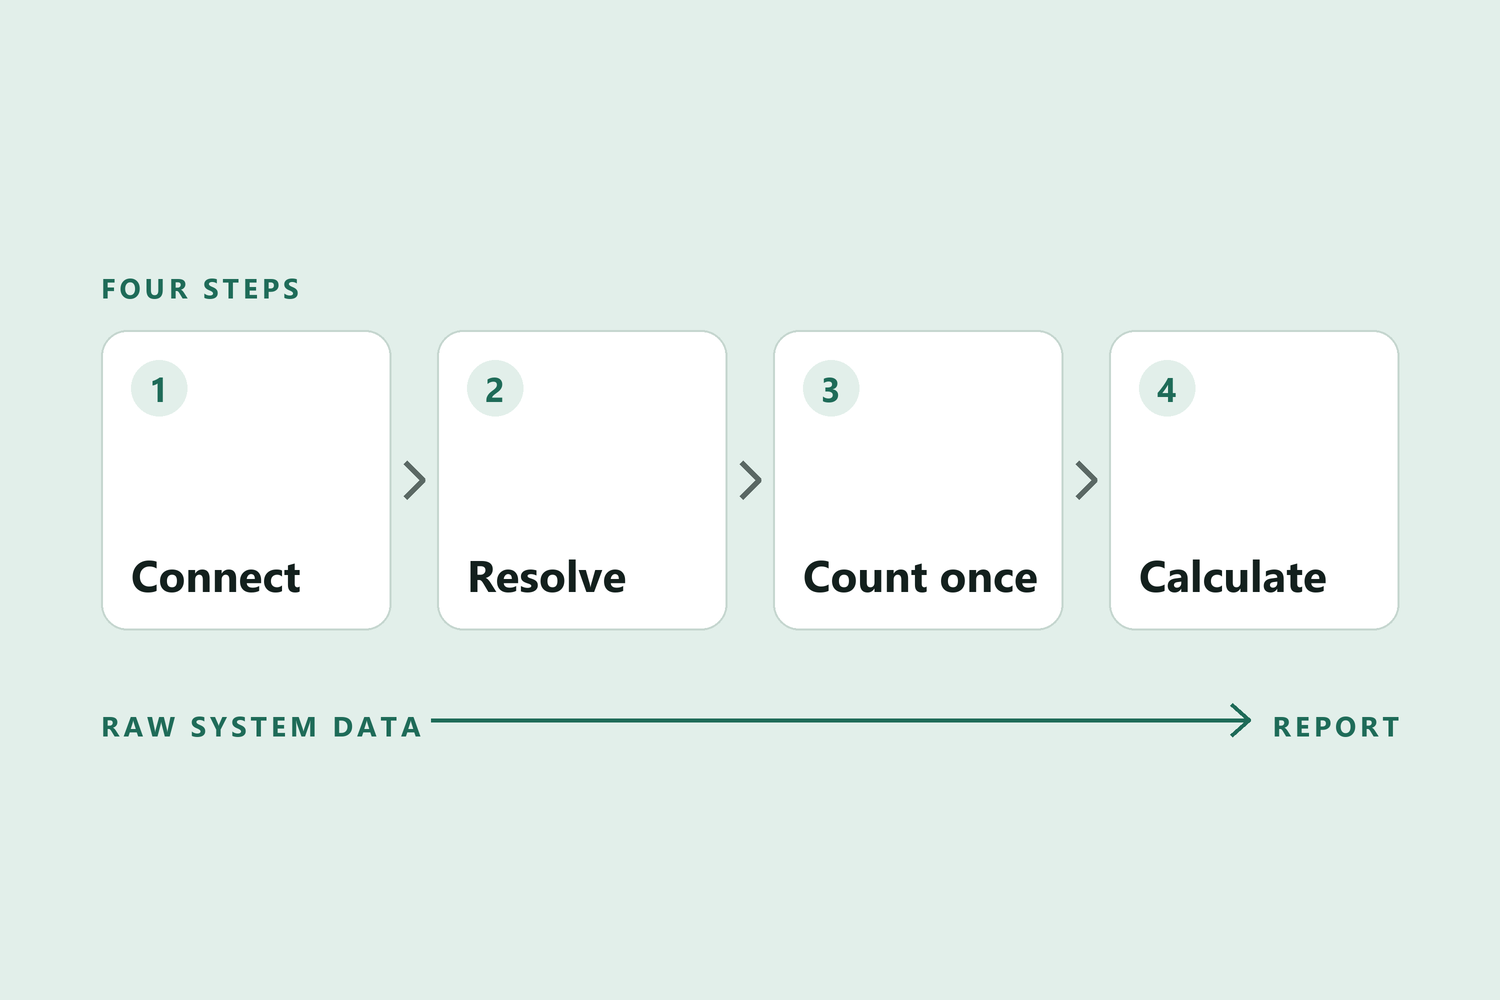
Unified Data
Integrates access control, WiFi, workplace apps, point-of-sale, fitness, conferencing, and more into one connected feed.
150+ Metrics
Standardized into a single layer, comparable across buildings, tenants, and time.
Decision-Ready Output
Tenant-level engagement scoring, utilization patterns, leasing economics, and early risk indicators.
Every dollar of operating investment maps to a measurable line item
REKalibrate isolates the marginal contribution of the operating platform across five value drivers, each tied directly to standard real estate economics.
Well-operated buildings engage tenants at 2.4× the market rate
Investing in amenities alone isn't enough. The owner augmented its amenities with best-in-class programming, hospitality operations, and technology, and the combination translates into measurable outperformance against its peers.
Peer benchmark: REKalibrate institutional dataset of Class A office assets with active amenity programs, 12 months ended March 31, 2026.
The signal surfaces before the lease decision
Engagement Rate is the first signal to move, quarters before a lease decision is made. And its level correlates tightly with the outcome: tenants who renewed or signed engaged far more than those who vacated.
2.4×the engagement of tenants who stayed or signed
Same platform. Three markets. Three results.
Together, the owner and REKalibrate analyzed three Class A assets in 2025 across different submarkets, business plans, tenant compositions, and capital structures.
Asset A
Asset B
Asset C
The Business Case
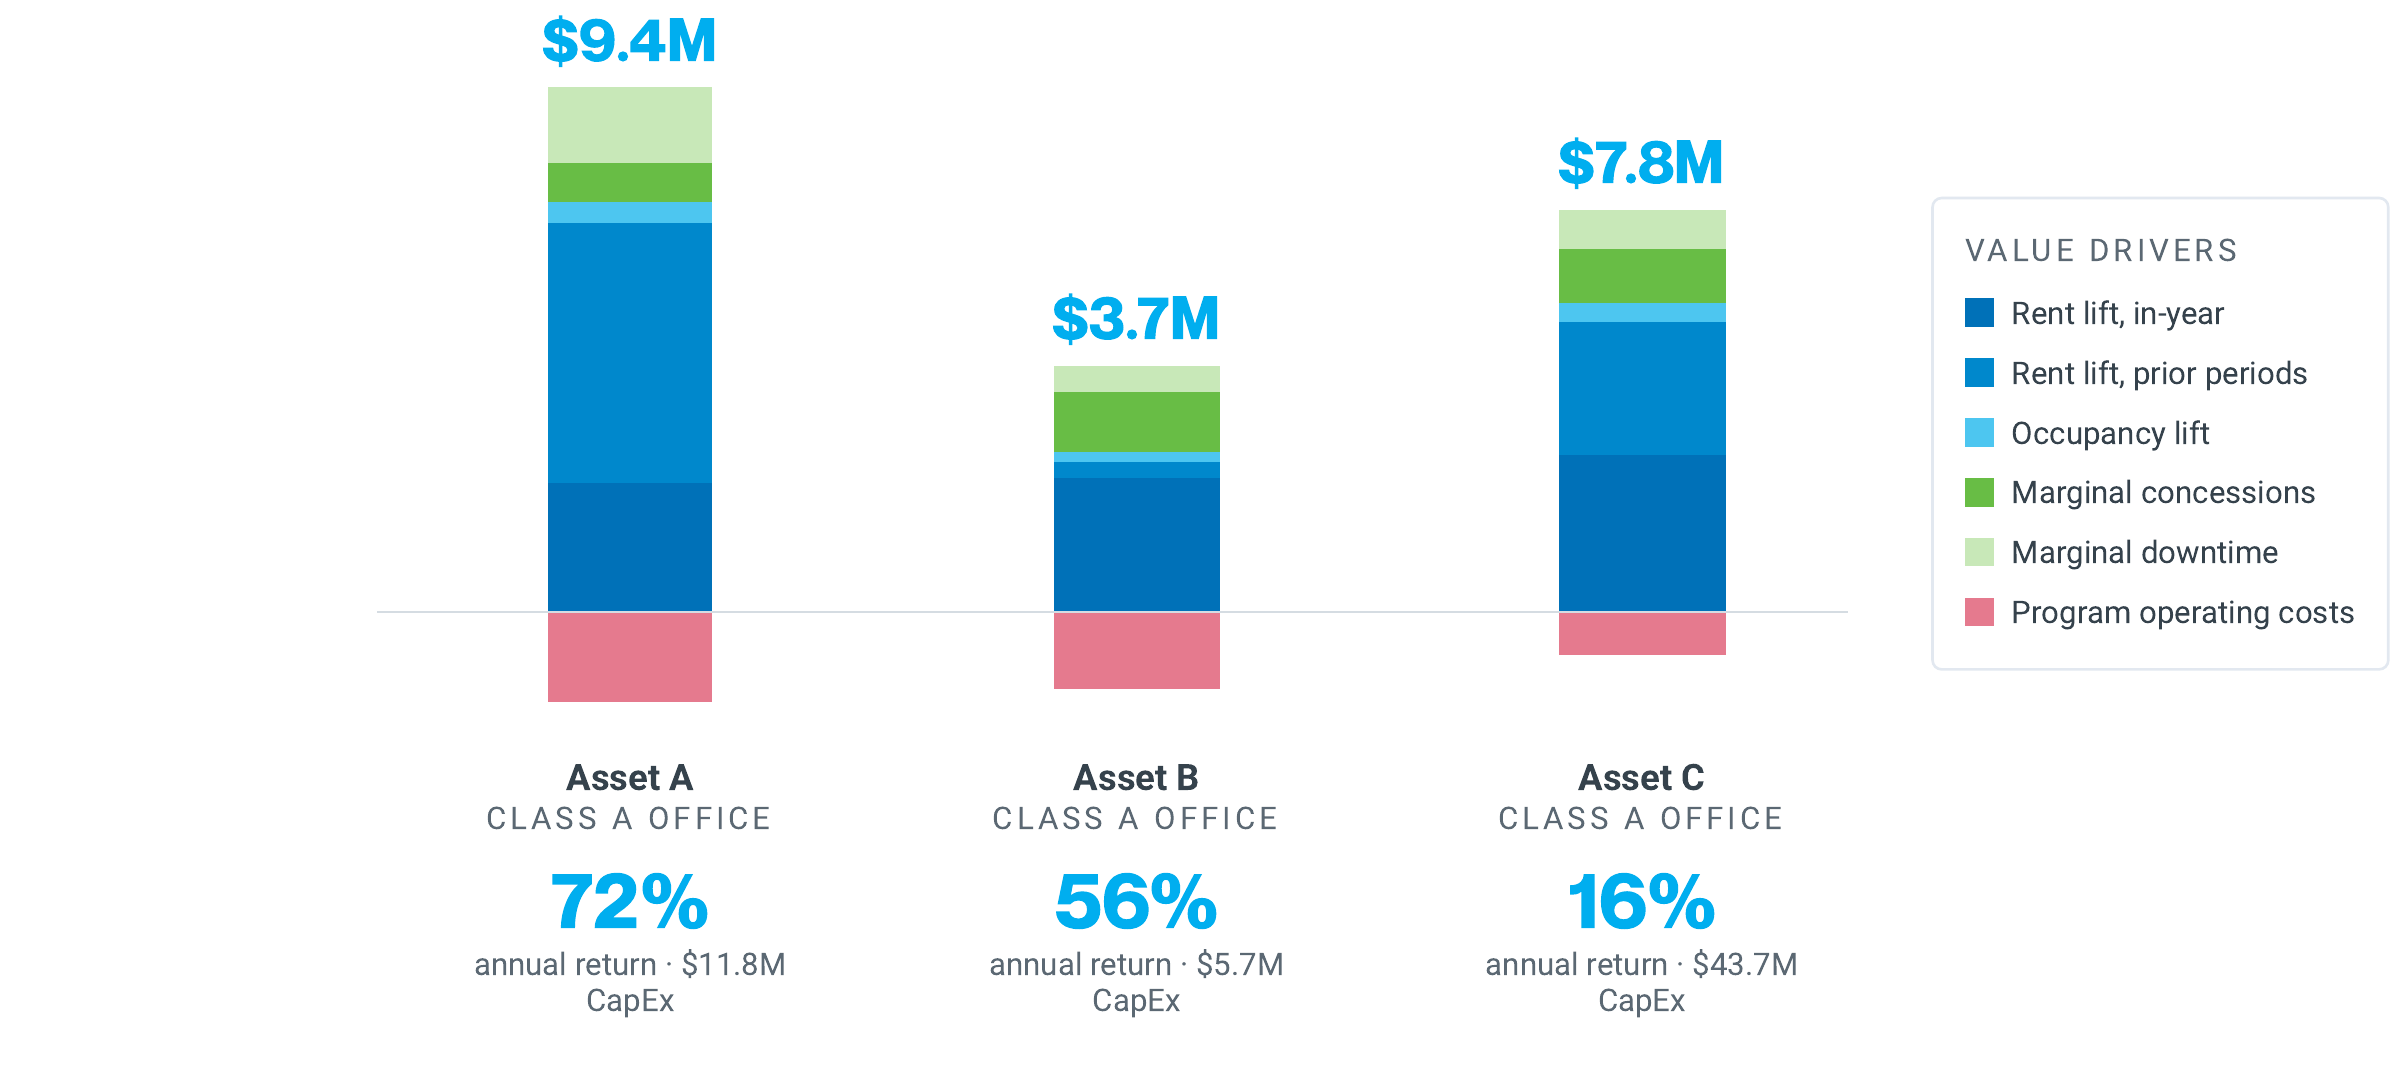
Each driver is calculated against a counterfactual baseline of submarket rents, market-standard vacancy, and standard underwriting conventions.
We scored every tenant to show where hospitality effort belongs
Engaged by the owner, REKalibrate scored every tenant at each asset on two dimensions, giving the owner's third-party hospitality operators a cohort map to work from.
Engagement
Participation in programming, amenities, services, and technology, measured continuously.
Utilization
Presence in the leased premises, measured continuously.
Retargeting lower-engagement tenants lifted engagement
Discover & Build
Operators held guided sessions with key tenant contacts to surface engagement gaps and company-specific priorities.
Launch & Measure
Tailored marketing, in-suite experiences, and curated programming were deployed; REKalibrate tracked response across reservations, fitness, and events.
Iterate & Elevate
Results were shared with tenant groups and high-impact tactics prepared for broader rollout.
The industry has been guessing. Now it doesn't have to.
For the first time, owners have a rigorous, data-backed framework for attributing financial outcomes (higher rents, lower vacancy, fewer concessions) directly to their investment in workplace experience. The owner and REKalibrate have demonstrated that operating capability, together with asset quality, determines outcomes in today's market.
Want to learn more about how we help teams measure Engagement and better understand retention? Reach out and let's chat.