Prove the experience is working.
Track engagement across every amenity, event and shared space — attributed to real people and the organizations that pay the rent, whether or not they ever downloaded the app.
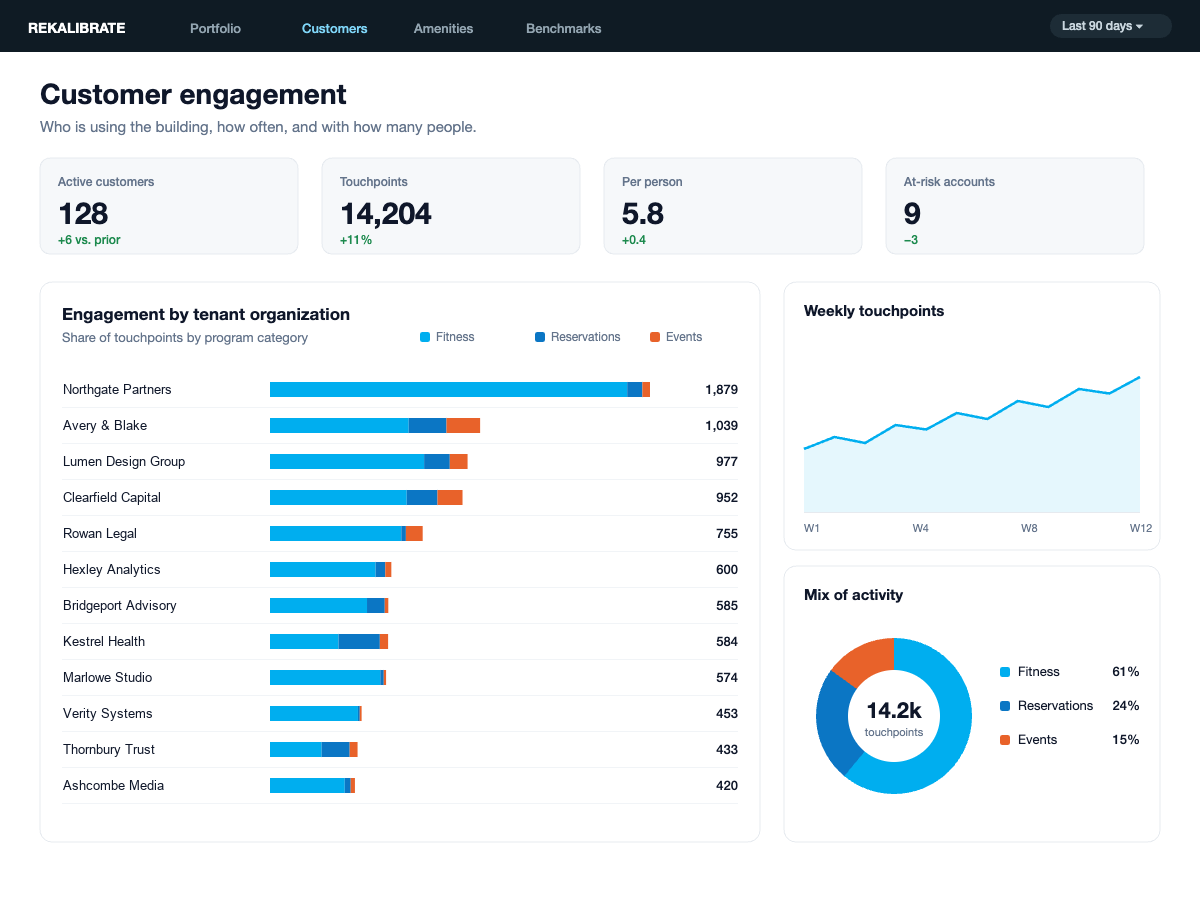
Track engagement across every amenity, event and shared space — attributed to real people and the organizations that pay the rent, whether or not they ever downloaded the app.
When engagement is measured through a tenant app, the ceiling is the download rate — and a third of downloads never activate. Events require a check-in. Reservations capture only the person who booked. Amenity use depends on someone remembering to scan a QR code.
The result is a number that describes your instrumentation, not your building. Whole floors can register zero attributed activity, and nothing in the report tells you whether that's disengagement or a data gap. Those are opposite problems with opposite responses, and the difference is a poor customer experience going unnoticed.
A branded captive portal records name, work email and company once, at connect time — in the lobby, the lounge, the fitness center, the conference center.
Every session, booking, RSVP and swipe collapses into one profile and rolls up to the tenant organization — deterministic keys first, probabilistic signals second.
Engagement gets an honest denominator, every rate becomes comparable, and the tenants drifting toward the exit surface while there's still time to change the outcome.
Drill into any organization to see which of their people are on site, how often, and which parts of the building they actually use. A customer's footprint is fixed until renewal — their engagement isn't. That makes it the lever site teams still have during the life of a lease, and the one that decides whether they stay.
Customers above 30% engagement retain at 2.5× the rate of those below it — which is why an honest engagement number is worth getting right.
Every event, class and amenity gets reach and depth against the resolved population — so you can retire what nobody uses and fund what earns renewals.
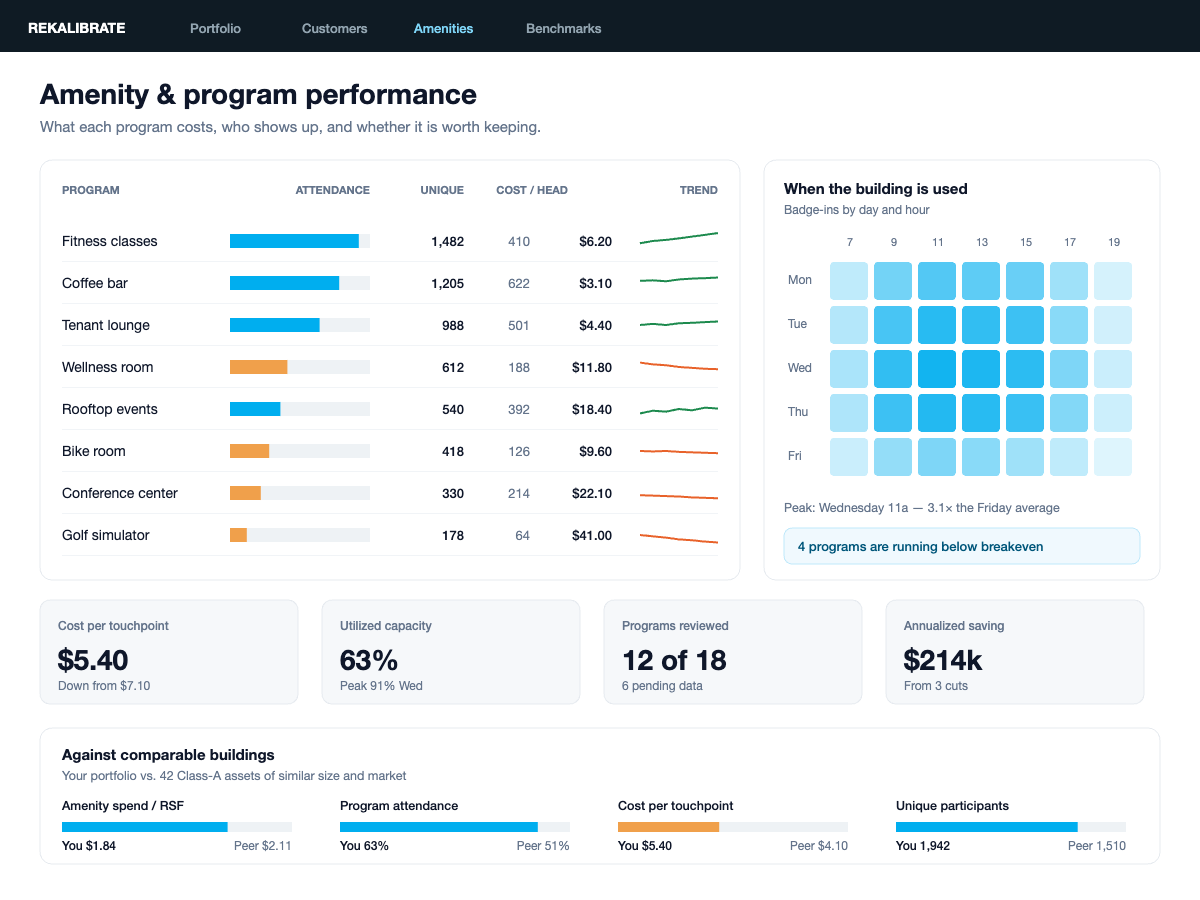
Retention cost a fraction of new leasing in concessions and preserves most of a lease's value. Engagement is the earliest reliable signal you have that a renewal is in play — which makes measuring it properly one of the highest-leverage things an owner can do.
The capture layer that makes engagement measurable without an app.
The connected, standardized base every other module reads from.
Turn engagement into a forecast of the space each customer will need.