Not every renewal is created equally.
Keeping a customer and keeping their footprint are two different outcomes. How they use the space today tells you which one you're facing — long before the negotiation starts.
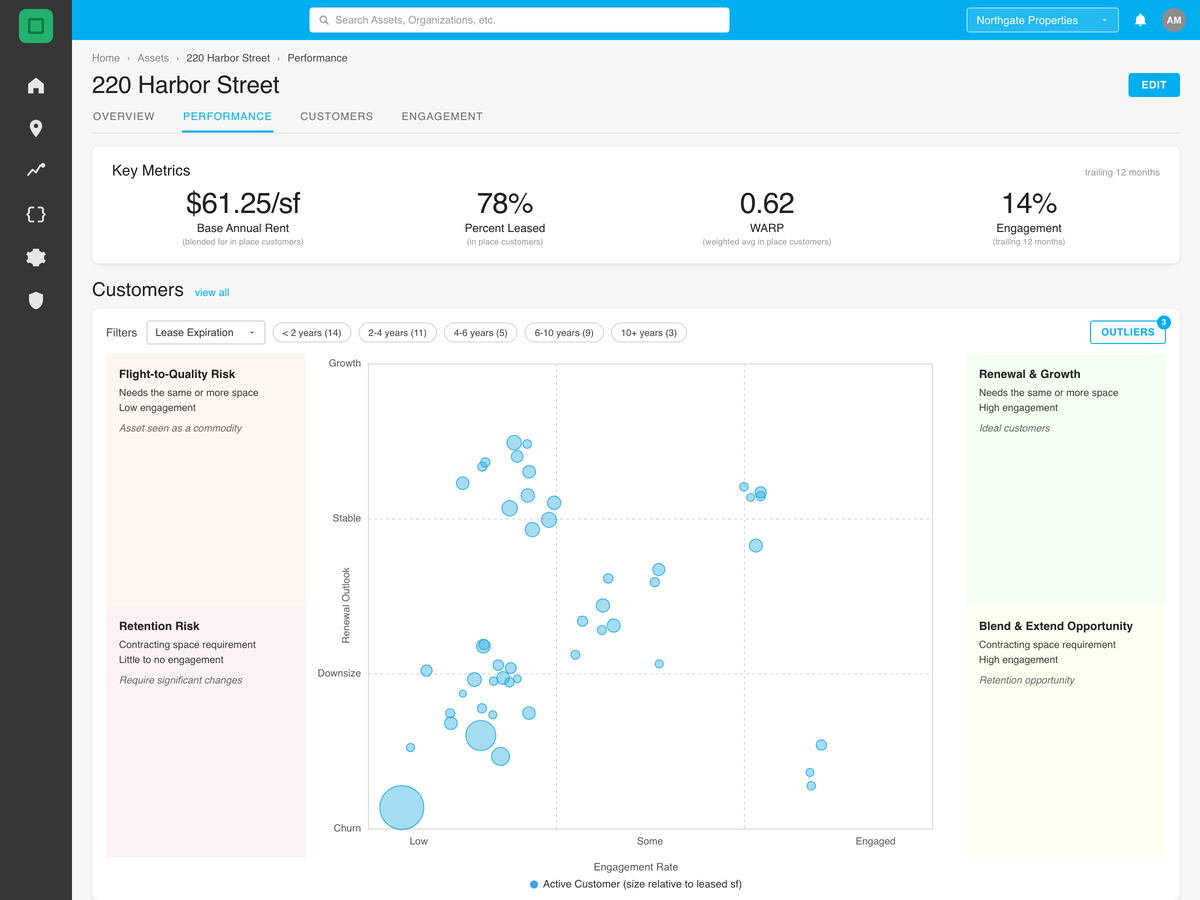
Keeping a customer and keeping their footprint are two different outcomes. How they use the space today tells you which one you're facing — long before the negotiation starts.
Most business plans carry a single number — call it 70% — applied evenly across the rent roll. It's a defensible portfolio average and a poor description of any individual customer. The tenant quietly running at a third of their desks and the one turning people away from conference rooms are not the same risk, and treating them as one number puts the plan wrong in both directions at once.
That assumption has also aged badly. Customers behave differently in 2026 than they did when the last cycle's benchmarks were set: AI is reshaping headcount and the mix of work that happens in an office at all, hybrid policies are still moving, workplace strategies get rewritten mid-term, and terms are shorter with far more appetite for experimentation. A renewal rate inherited from a market that no longer exists isn't a forecast — it's a placeholder.
Raw occupancy counts bodies at a door. We resolve individual attendance patterns — who comes in, how often, on which days, into which spaces — and turn that into a real measure of how hard each customer's footprint is working.
Keeping a customer in the building and keeping them in the same footprint are two different outcomes with two different plays. Holding them apart tells you where to defend the relationship and where to plan for a resize — a customer can be certain to stay and still hand back a floor.
Efficiency today is the best available predictor of the space a customer asks for tomorrow. That turns the renewal conversation into a modeled position rather than an opening offer you react to.
We read how a customer's people actually show up — how many days, which days, and how many at once — against the capacity the space was built for. That gives each customer an efficiency rating and a renewal outlook: a highly accurate projection of the area they will genuinely need, and whether that is more or less than they hold today.
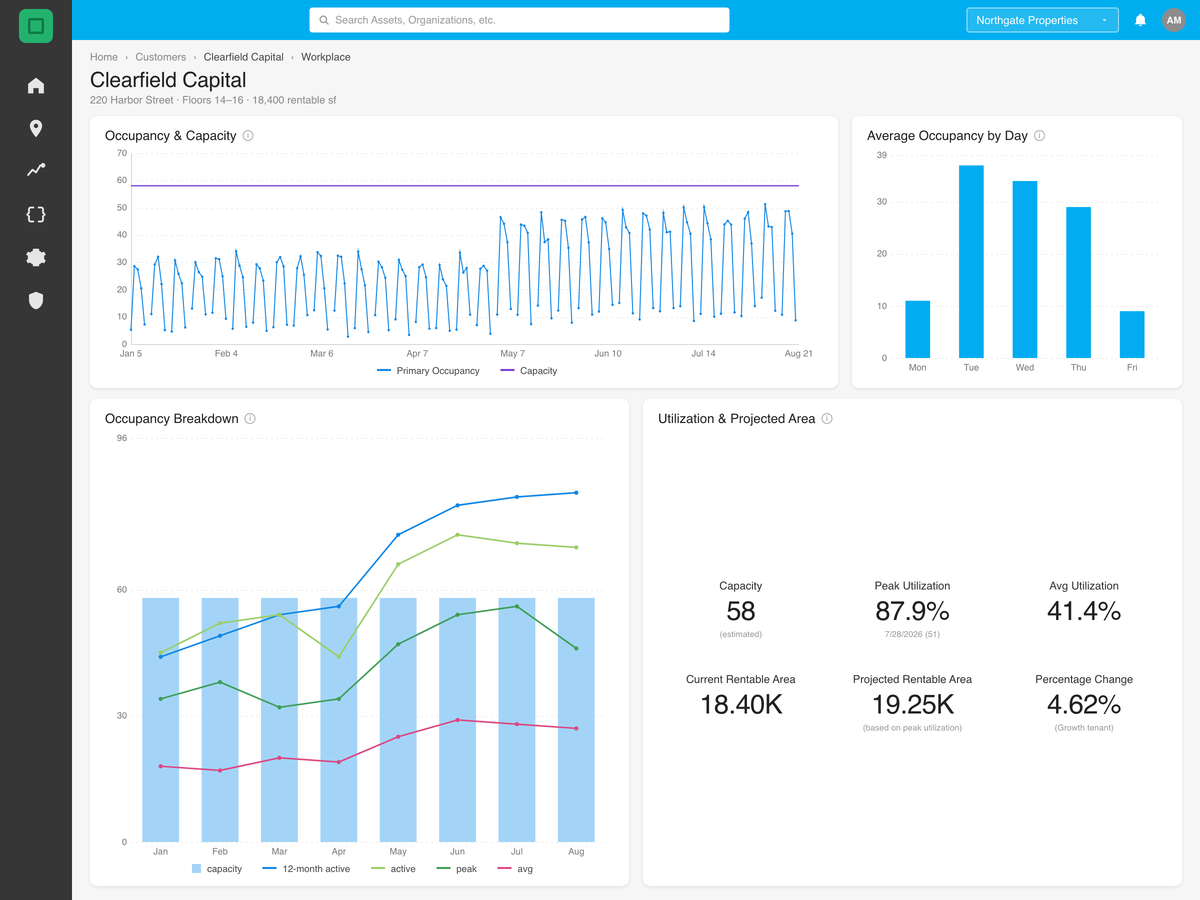
Attendance, peak utilization and space efficiency per customer, read against the space they lease. The tenant sitting at 30% and the tenant turning people away from their own floor both surface early — with enough runway left to do something about either one.
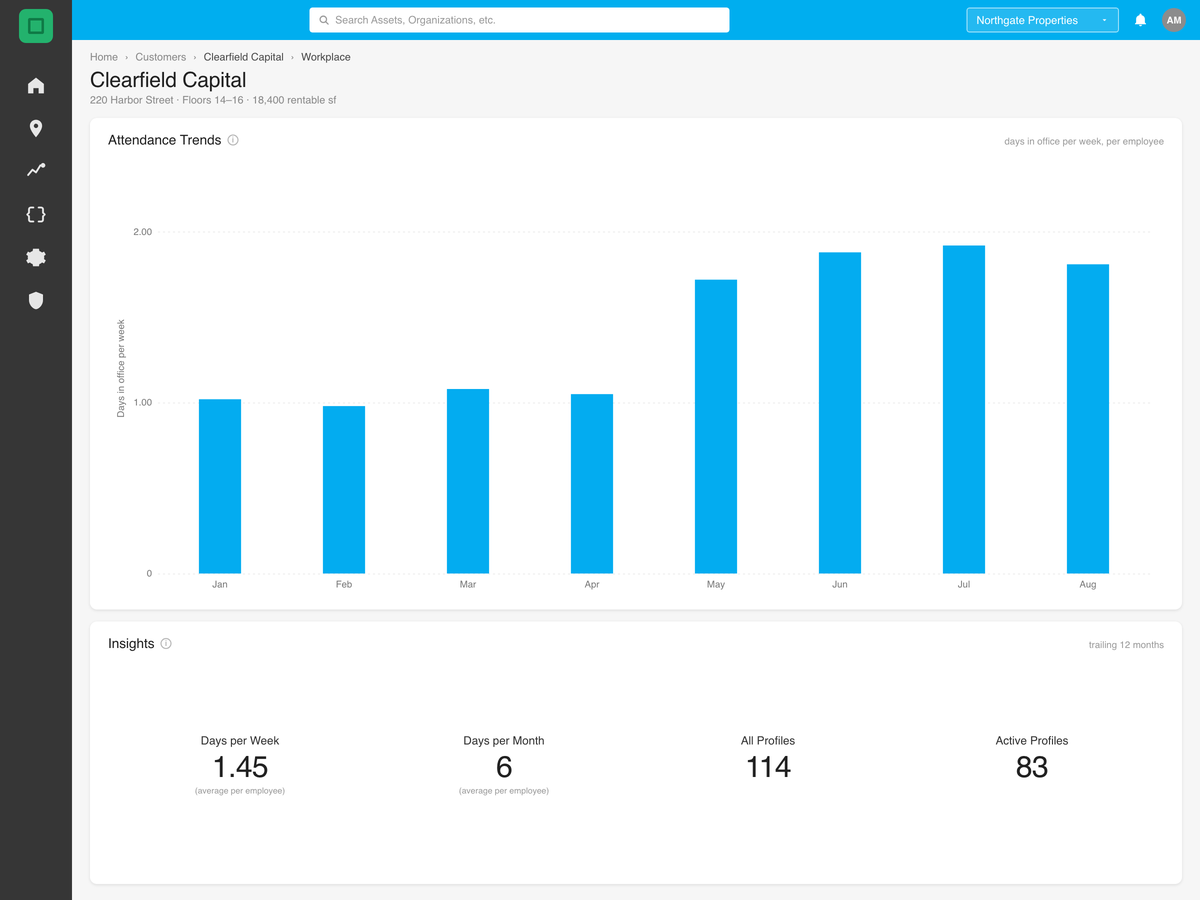
This is the depth of workplace analysis large occupiers commission for their own portfolios — the same methodology we've applied in occupier portfolio optimization work, pointed at your rent roll instead of theirs. Most of your customers have never run it on themselves. That asymmetry is the advantage.
The connected, standardized base every other module reads from.
Engagement as the leading indicator sitting alongside utilization.
Another honest read on how many people are genuinely coming in.