Amenity Forecast Case Study: De-Risk Amenity Investment Before Capital is Deployed
How many of each amenity space should we build, and how do we know?

How many of each amenity space should we build, and how do we know? A demand-driven sizing model for the subject property.
An outdated amenity program, and a capex decision the owner wanted to get right the first time.
The tower's amenity program was built for a different era of office use. Some spaces sat idle while others were overbooked.
Before redeveloping, ownership engaged REKalibrate to find out which amenities to build, in what mix, and how much of each.
We used a year of reservations from comparable REKalibrate buildings, segmented by industry, to predict demand from this building's tenant mix and population.
De-risk the capex: build the right footprint, sizing and mix of amenities before any money is spent.
Demand isn't uniform: each space type peaks at a different time and intensity.
Build too little and tenants are turned away at peak; build too much and capital sits idle. There are seven space types, and how much to build has to be answered one type at a time, not with a single across-the-board number. Wellness clusters at midday, golf runs all afternoon, and flex concentrates on Tuesday and Wednesday.
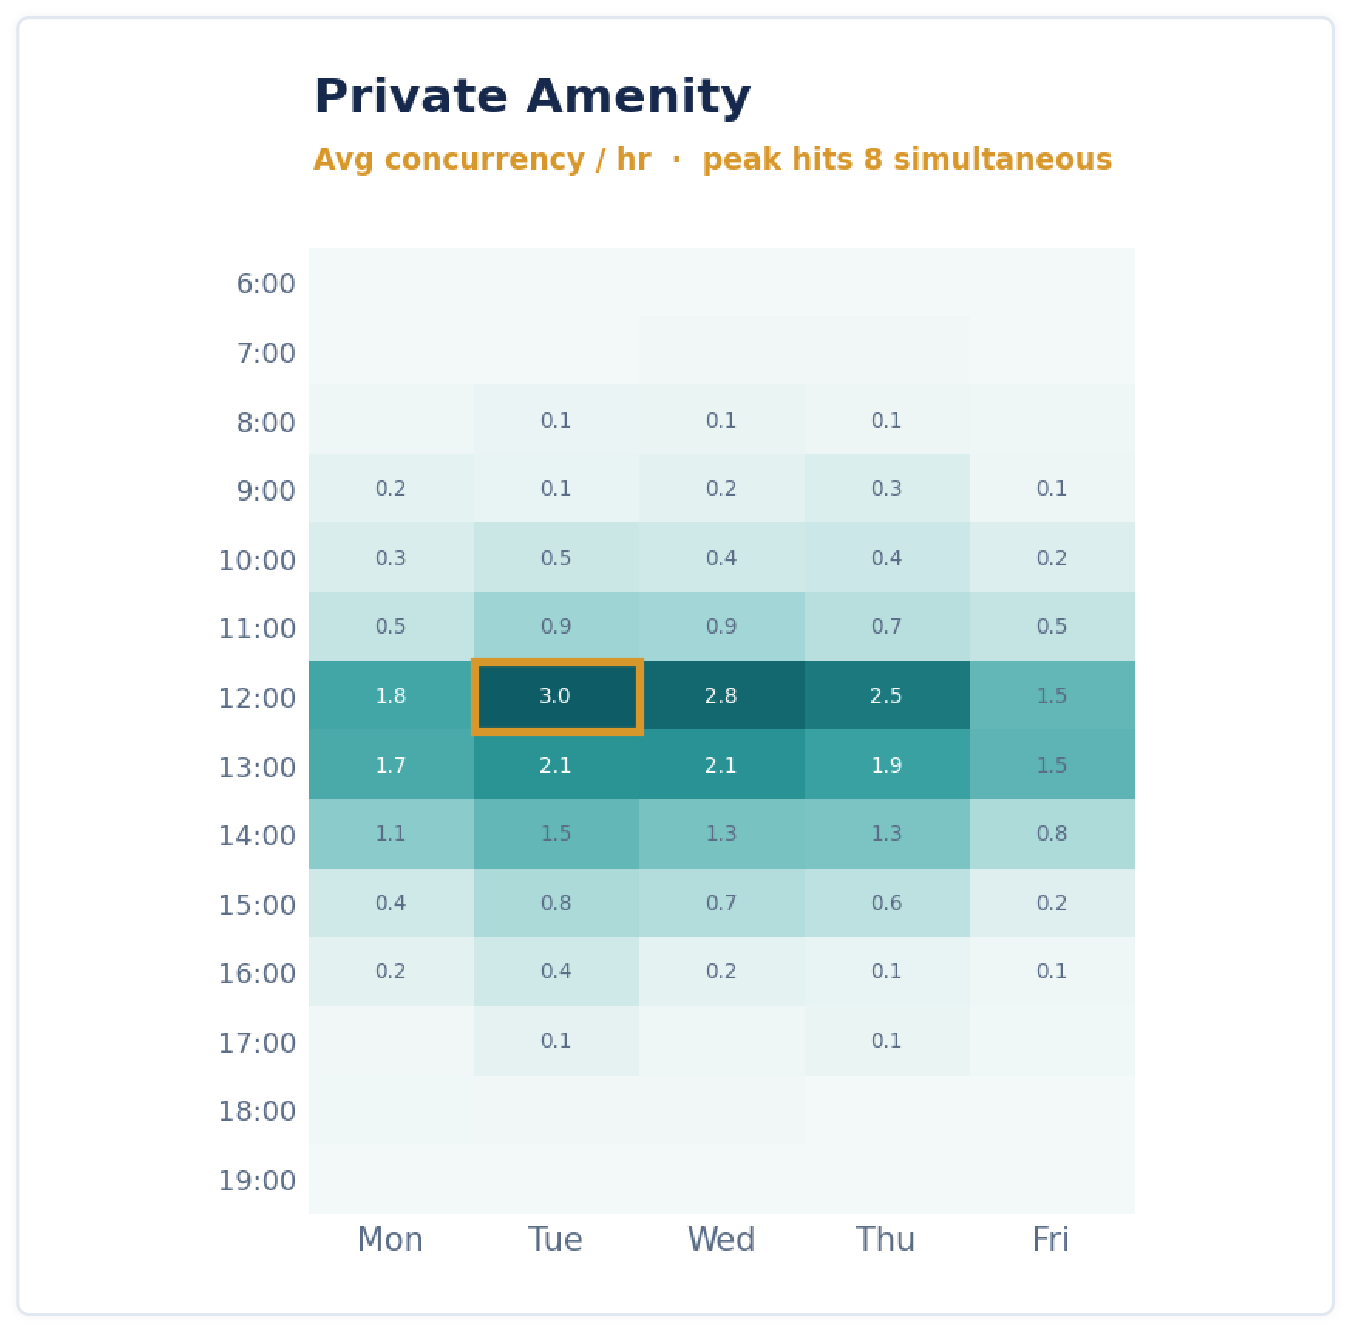
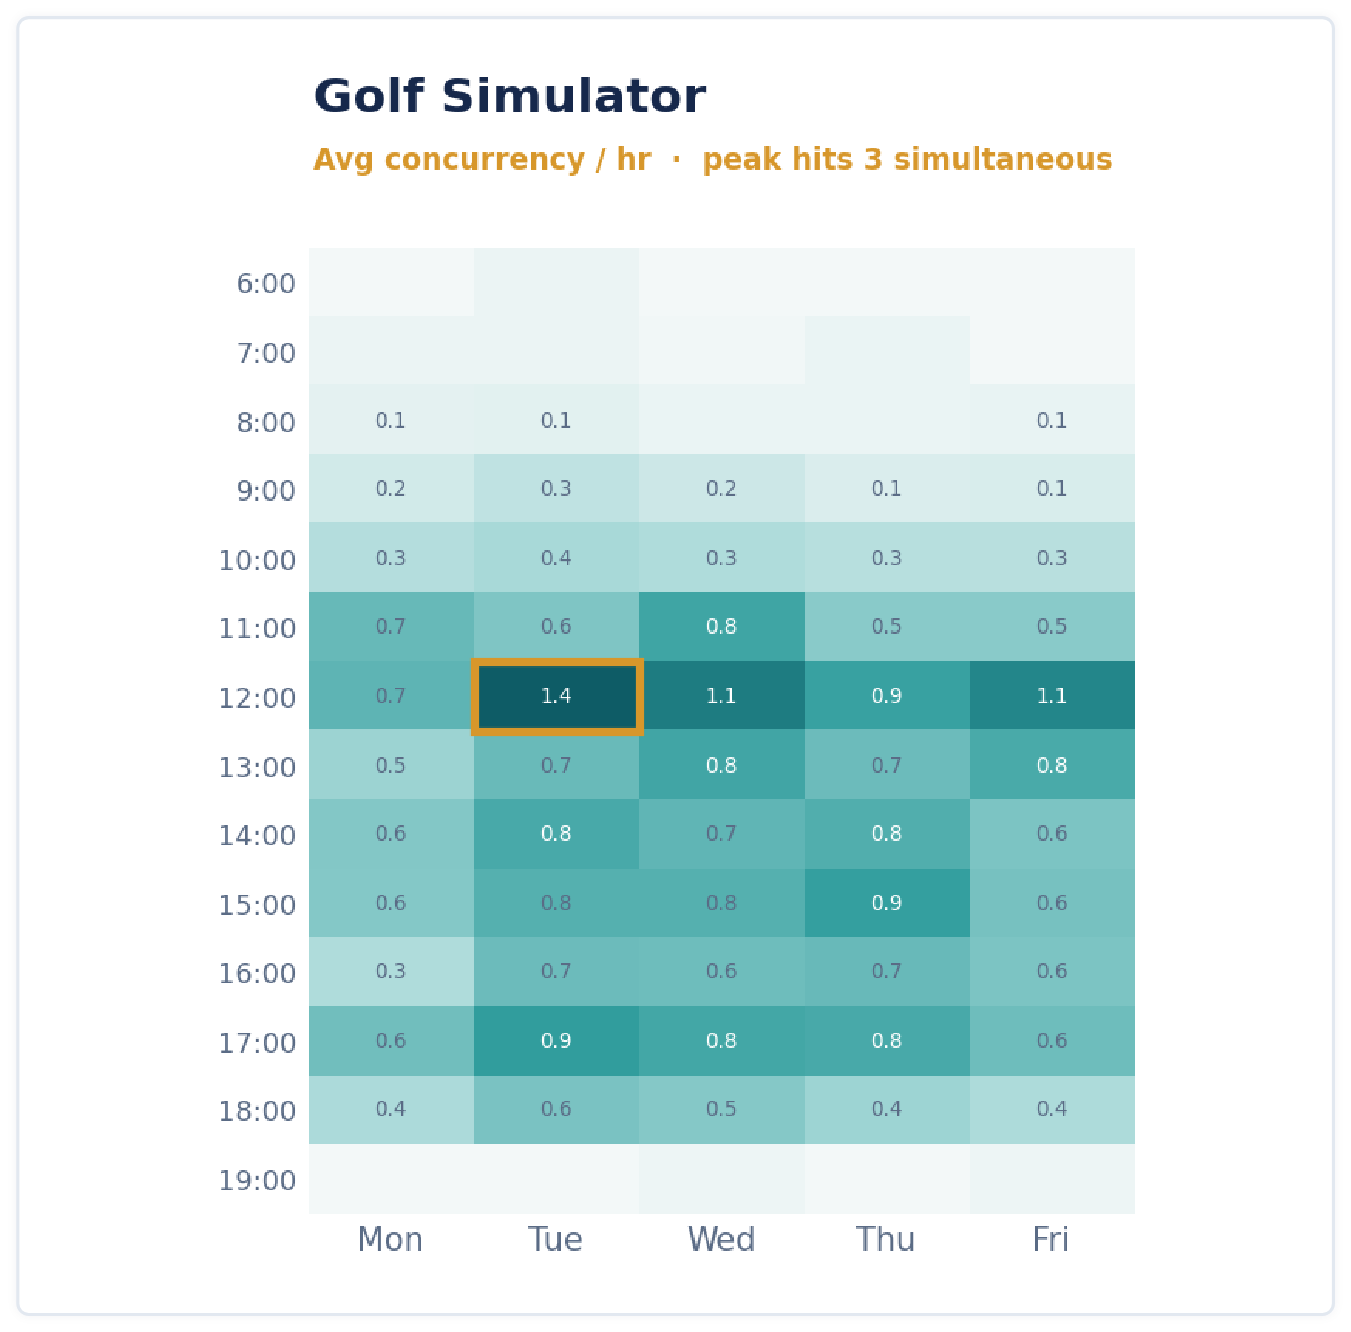
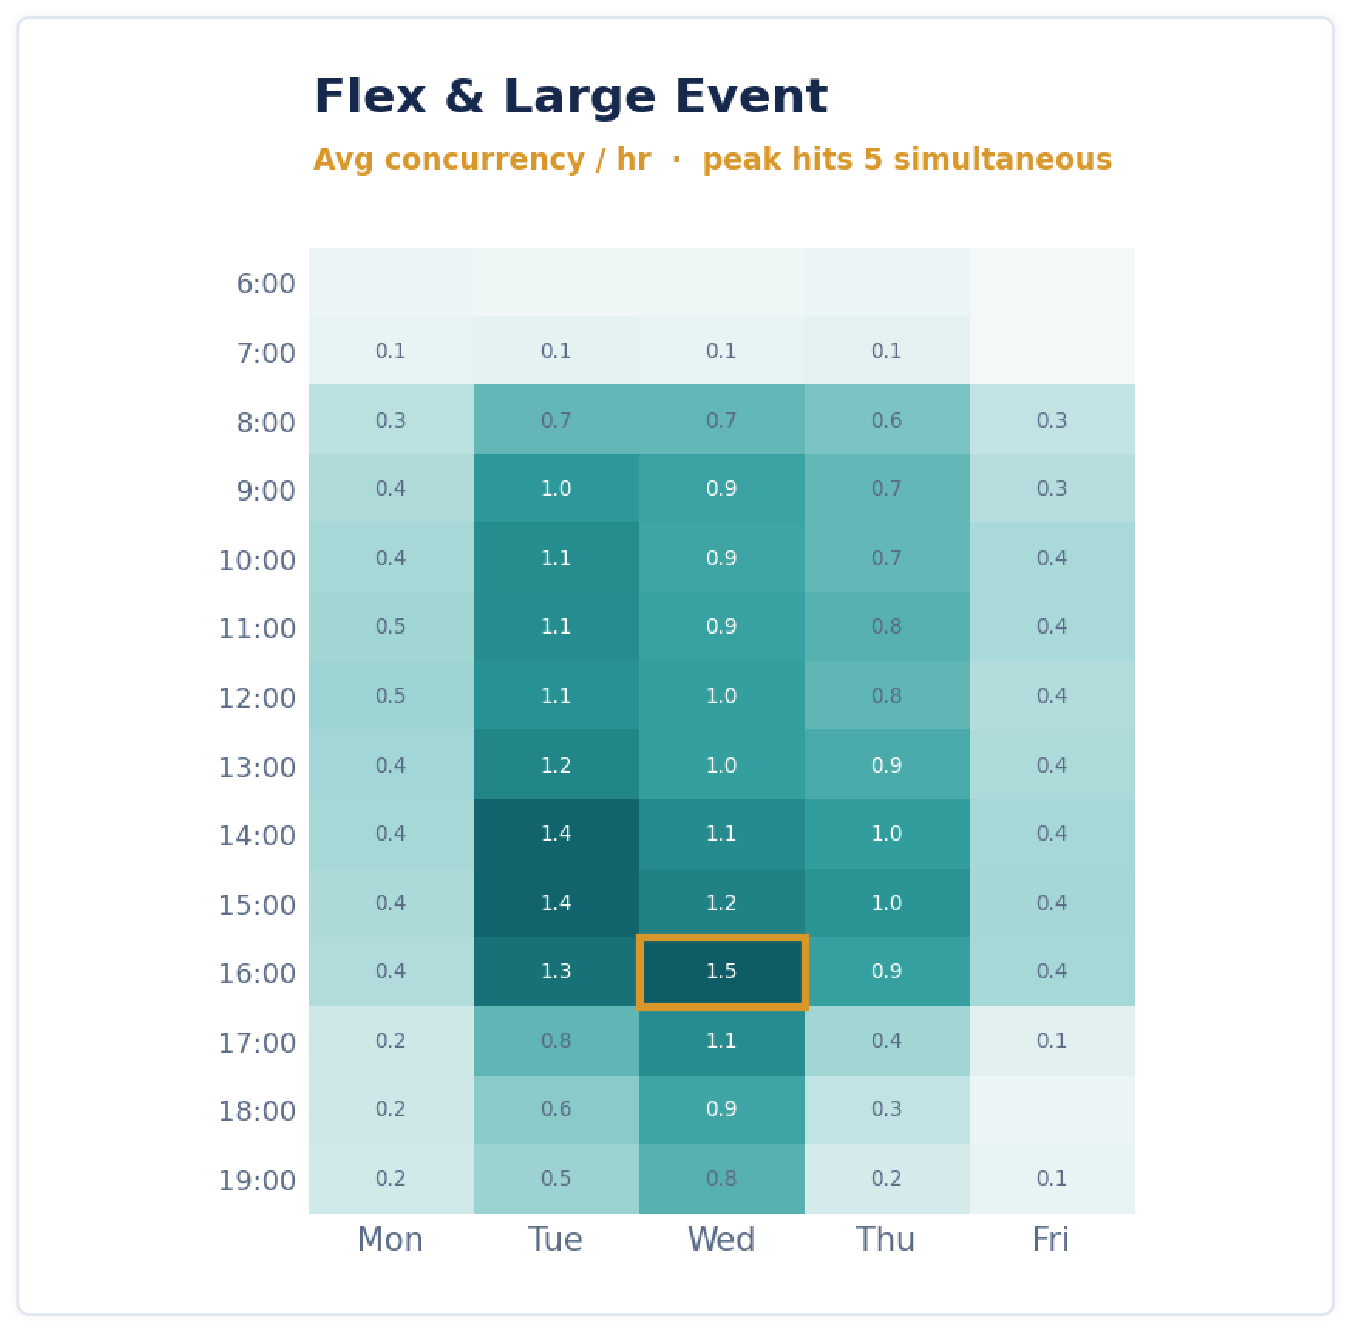
Booking demand, Monday to Friday, 6 AM to 8 PM. Darker means busier. Three of seven space types shown.
Industry mix by leased square footage.

Share of leased square footage. General tenant mix makes up the rest of the building.
Demand follows people, not square footage.
We tested twelve months of real bookings against both, and the result decides what we forecast from.
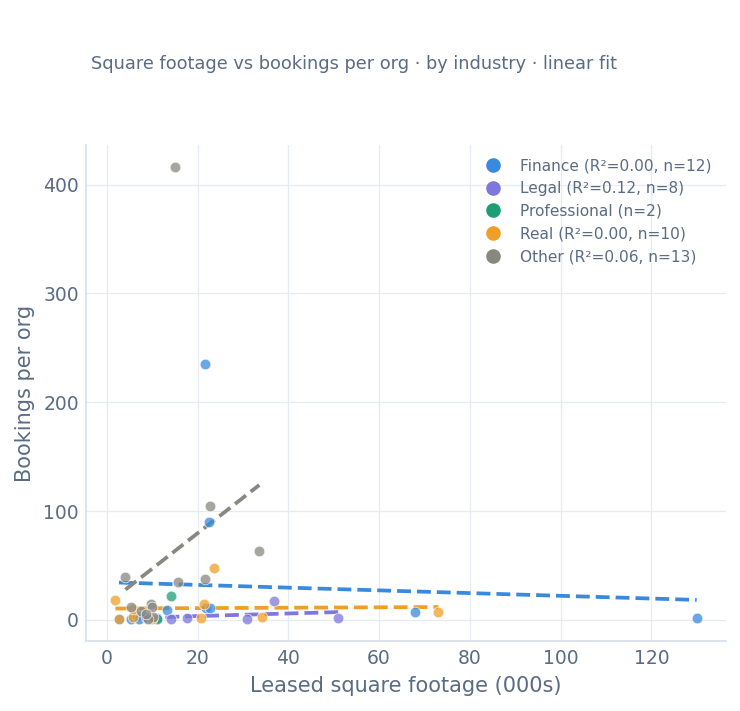
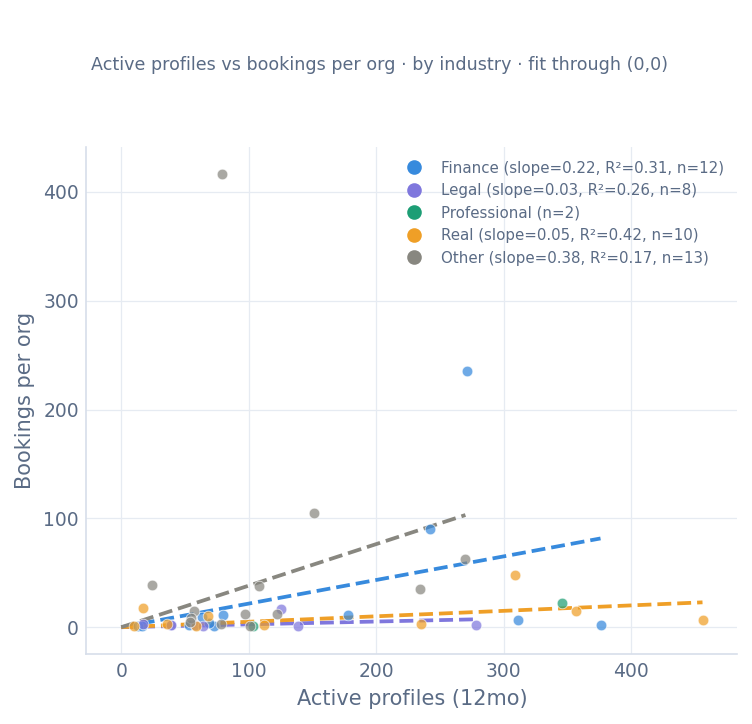
Each space type's demand is built up from the tenant mix, industry by industry.
The tenant roster
Each industry books every space type at its own measured rate, multiplied by session length.
Predicted booking-hours by space type
Bar length is predicted booking-hours. Segments are each industry's contribution. These predicted hours drive the space counts in the recommendation.
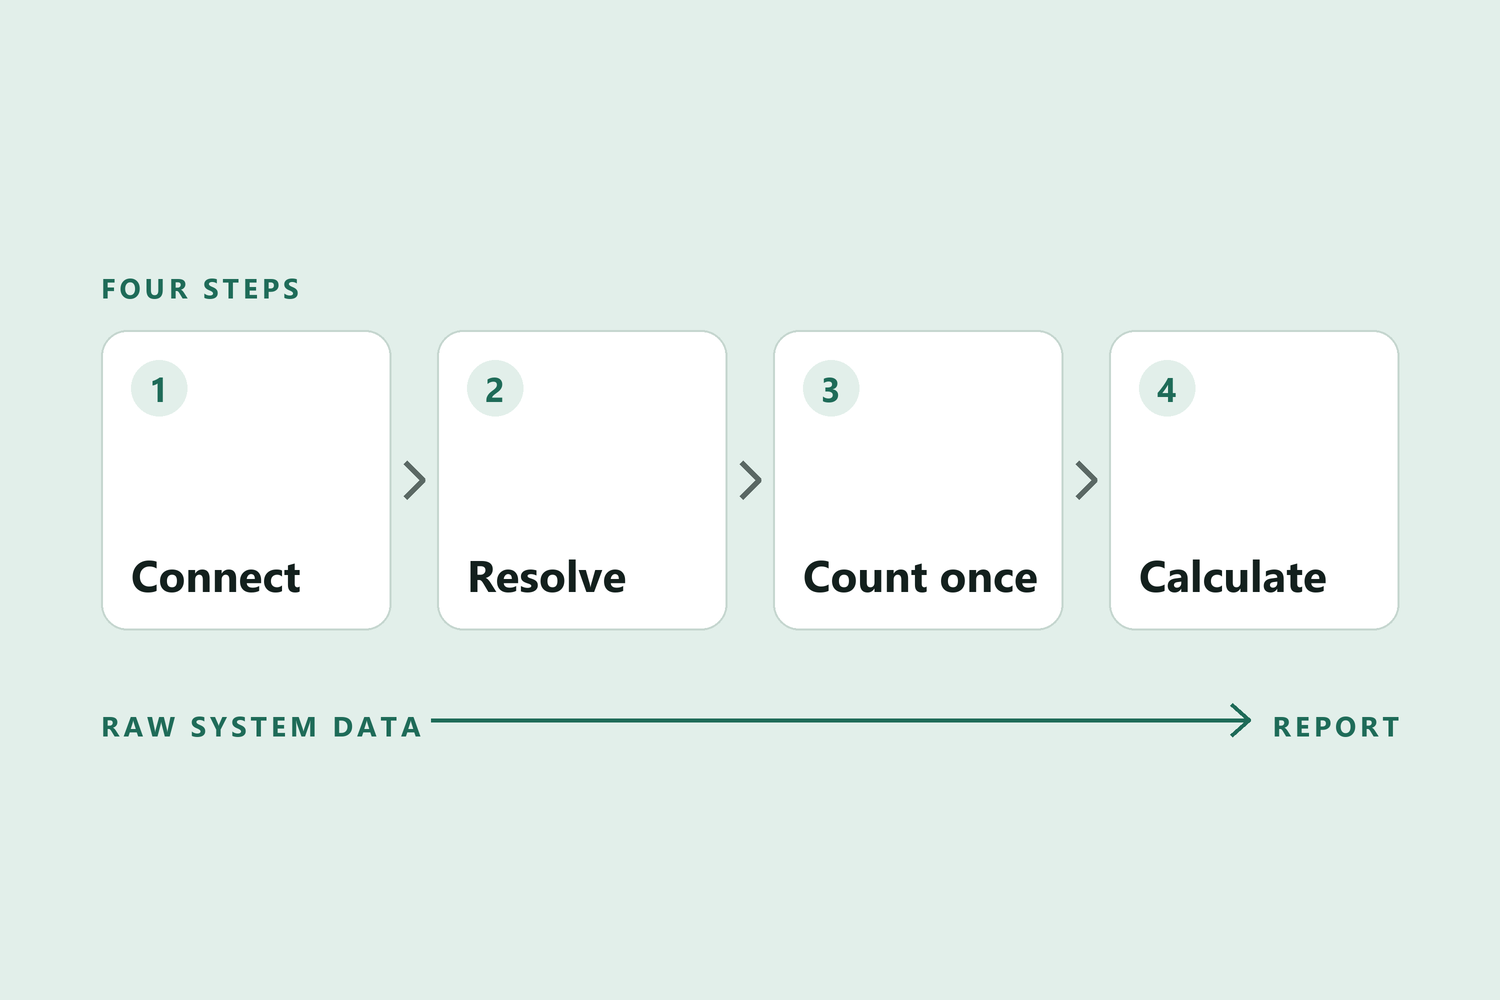
From people to spaces, in four auditable steps.
The count of a tenant's people occupying the building, measured against industry benchmarks.
Each industry books at a measured rate per active profile.
Bookings convert to hours via each space type's session length.
The number needed simultaneously at the peak is how many to build.
Every step is data-derived and auditable. There is no black box.
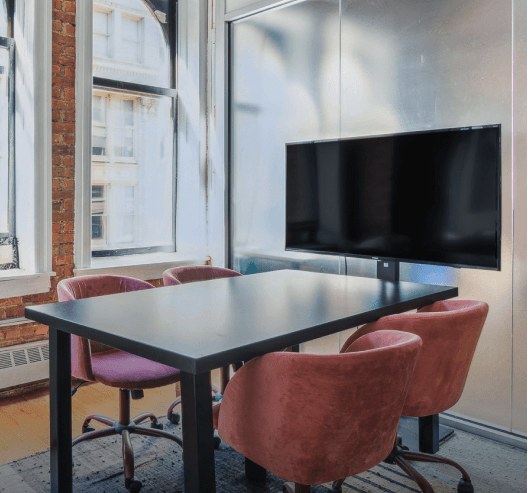
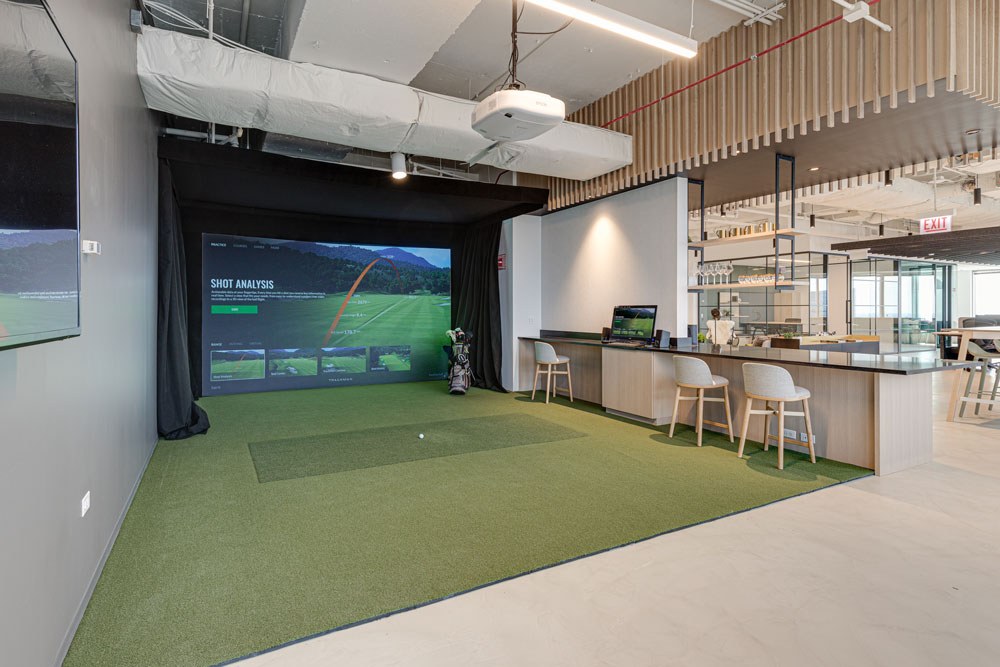
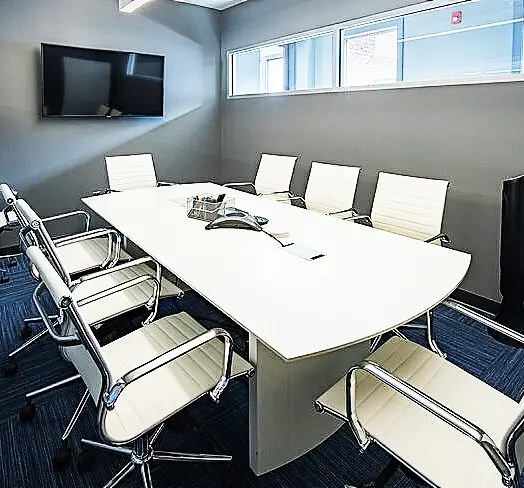
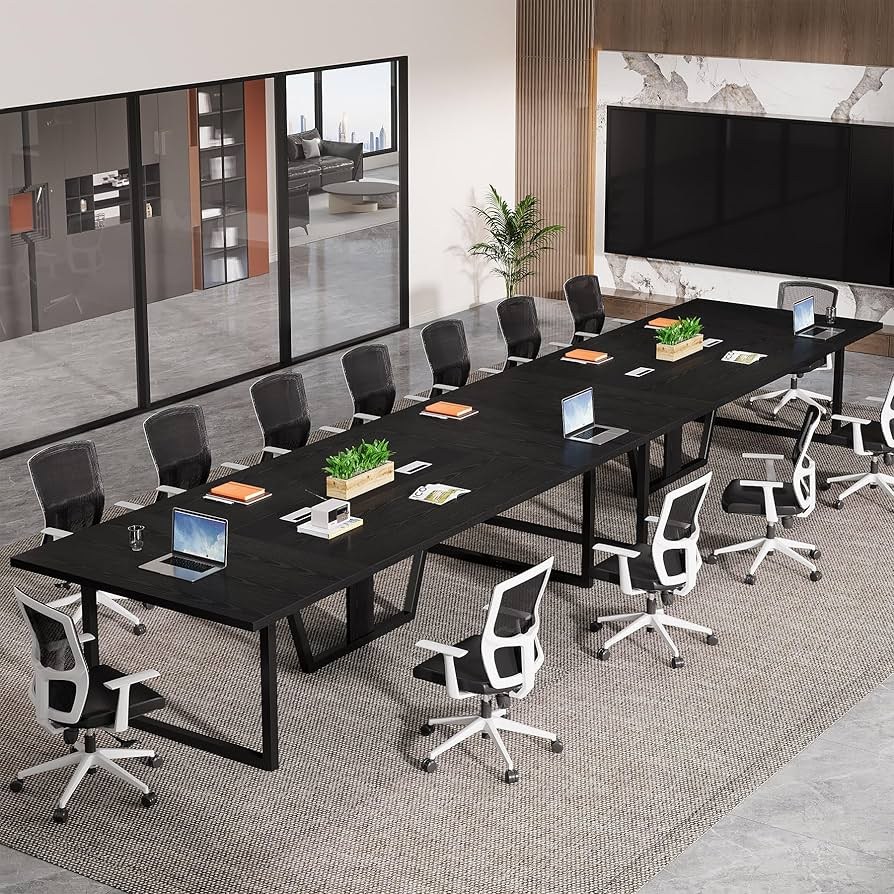
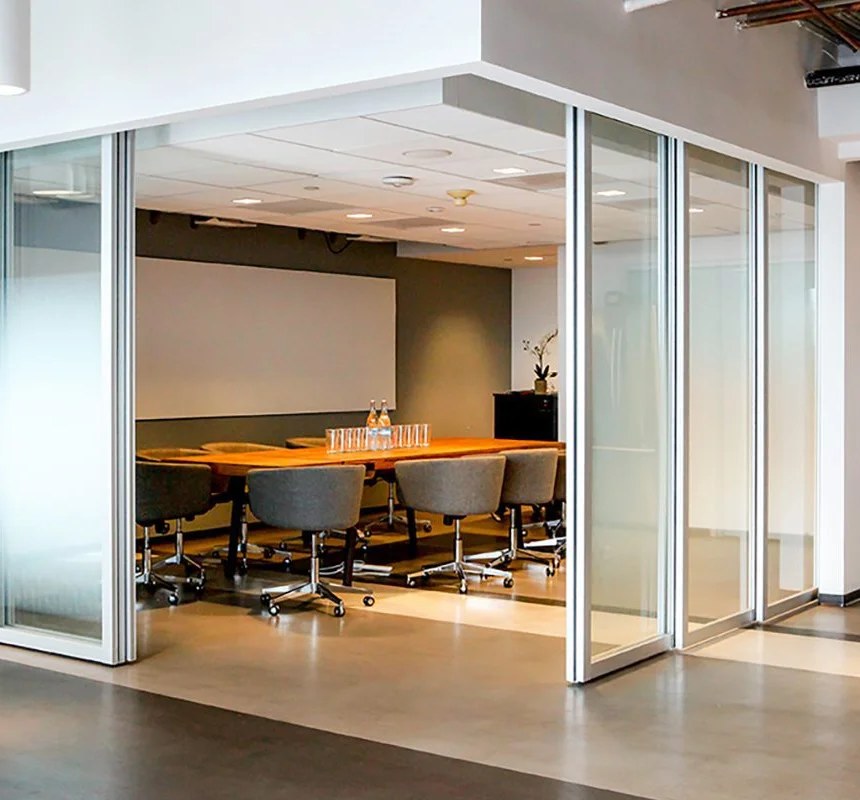
9 spaces at the subject property.
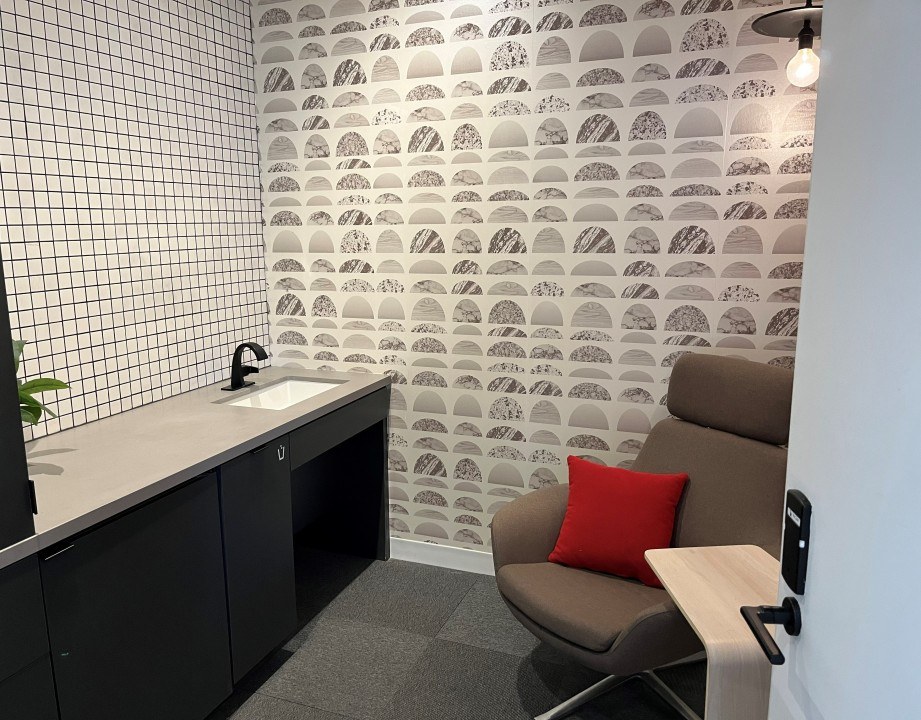 2
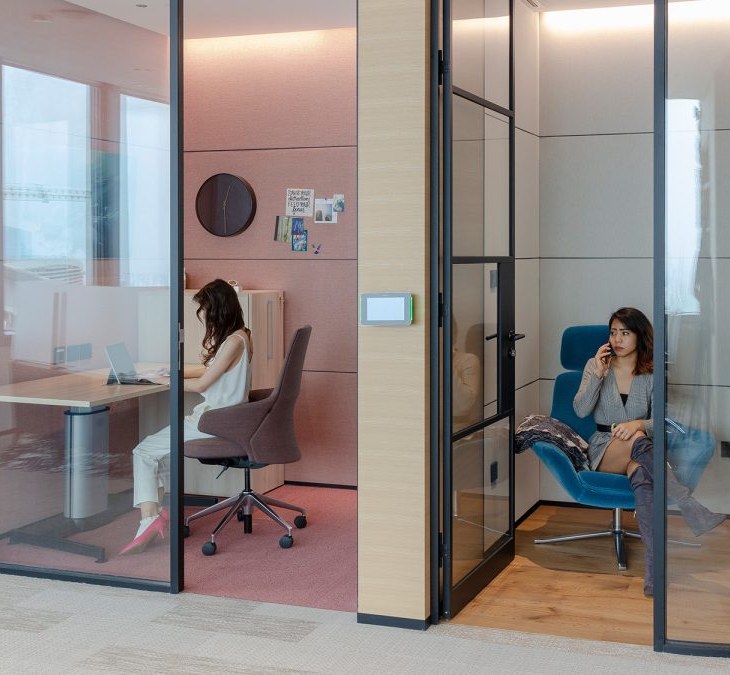 1
 1
 1
 2
 1
 1
Profiles reflect a global attendance-adjusted capacity by industry (a REKalibrate benchmark), not active headcount in the asset. Photos are examples of each space type.
What the data actually shows.
Real usage patterns, per-tenant behavior, and the demand signal behind the sizing model, pulled straight from the platform. These are sample views, shown for illustration, not the full dataset behind the model.
What tenants actually use, and who uses it most.
Confirmed hours by category

Top customers
Metrics reflect June 2025 to May 2026.
This is what a customer profile looks like.
Engagement funnel
What drives bookings: bookable spaces
Top 5 spaces shown, 301.0 hours in total. The remaining 27 hours are spread across 9 smaller spaces. Metrics reflect June 2025 to May 2026.
Demand detail by space group.
One view per space type: the per-organization signal and the weekly demand shape behind each recommended count. All views are based on comparable buildings.
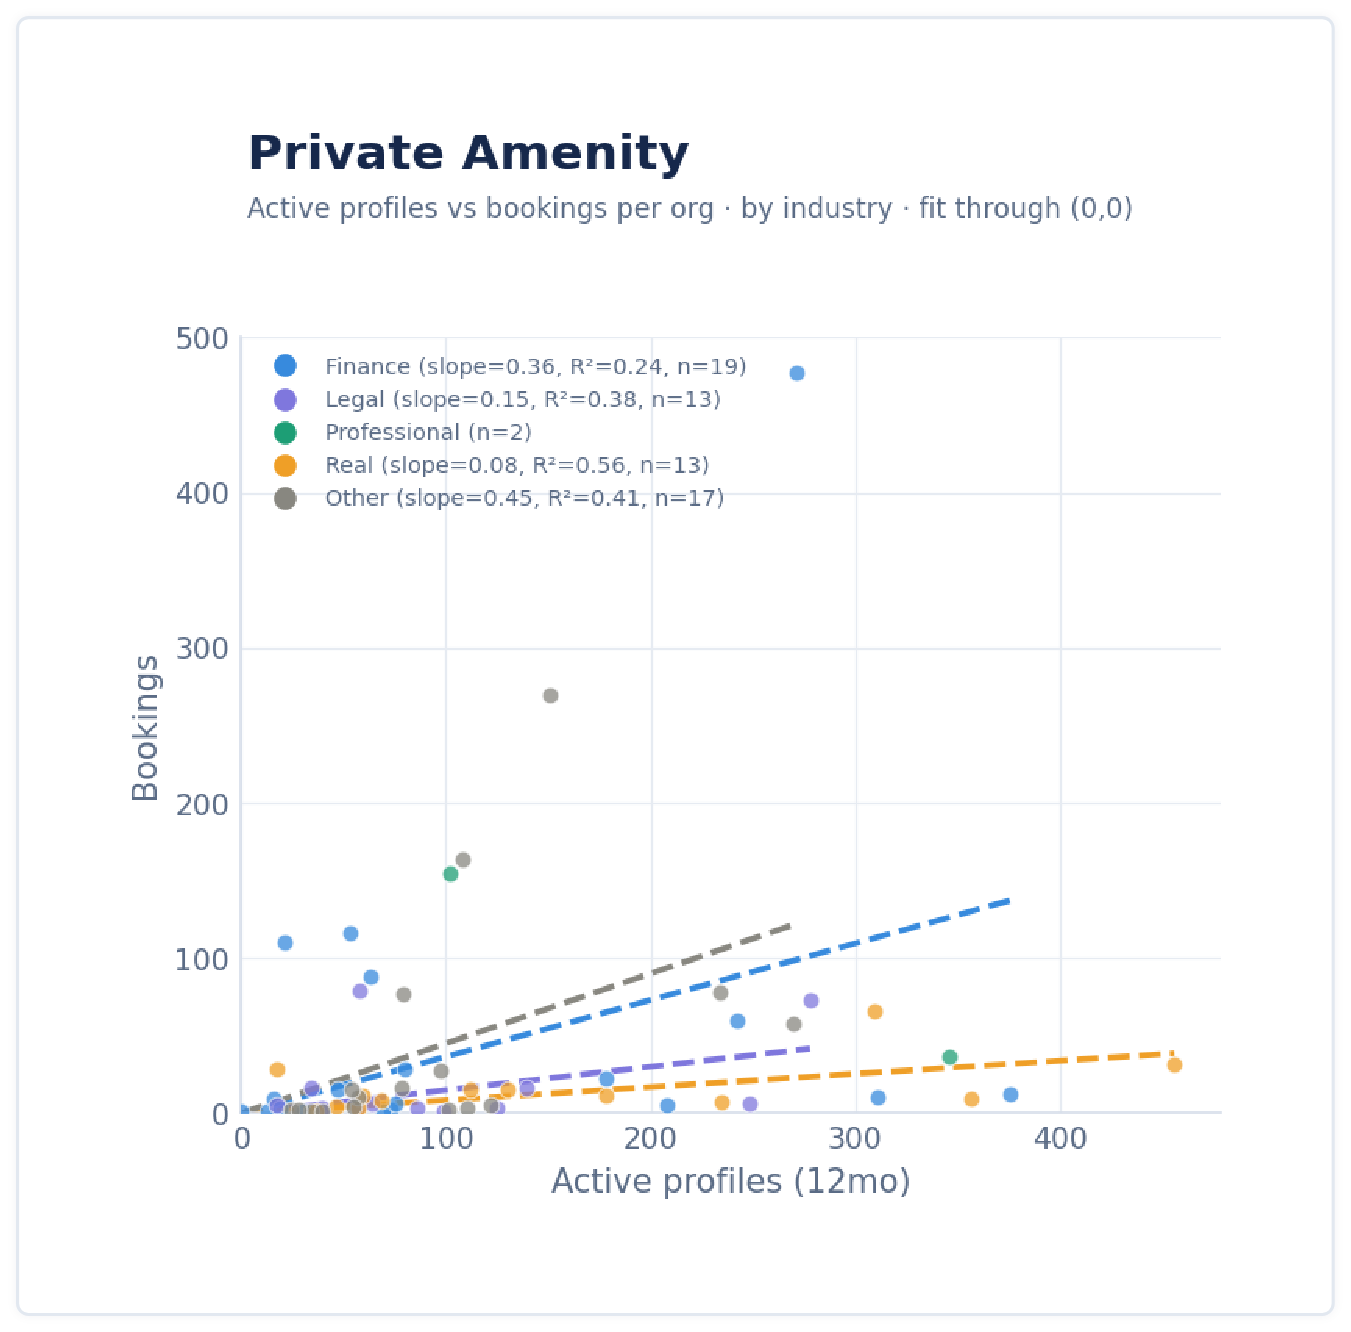
Private Amenity (wellness)
Active profiles predict bookings. Demand is concentrated at midday, with peak concurrency of 8.
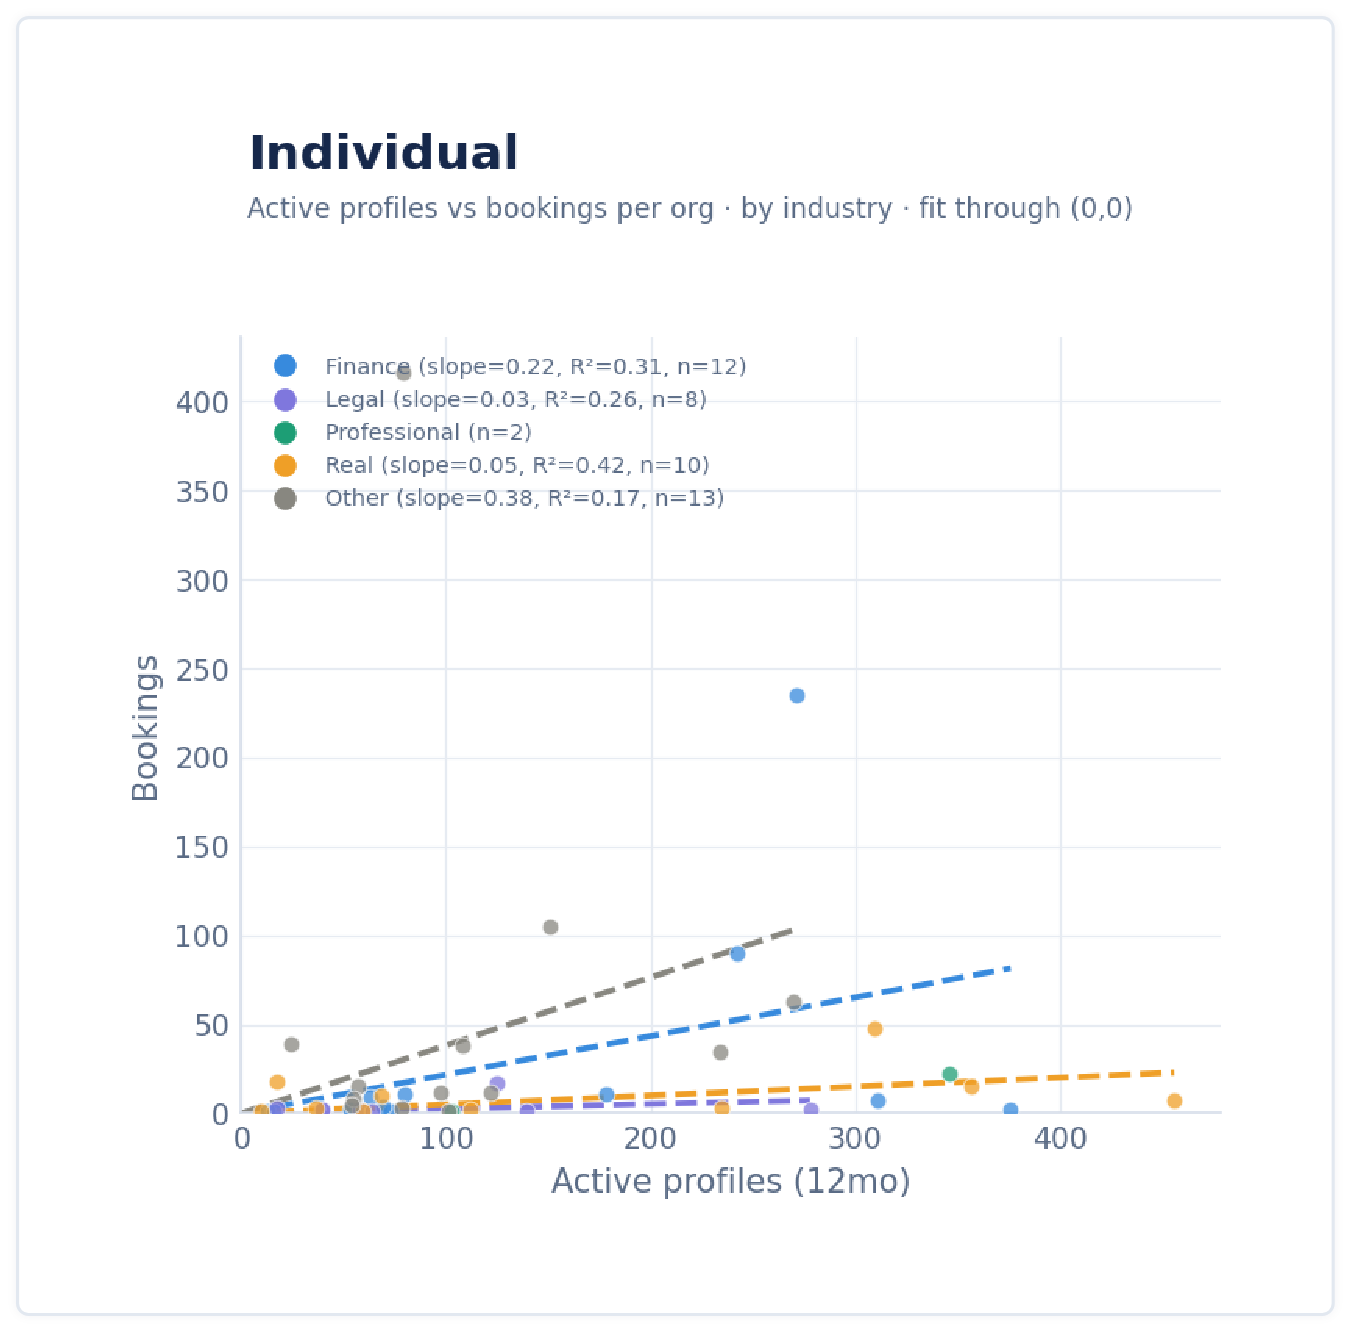
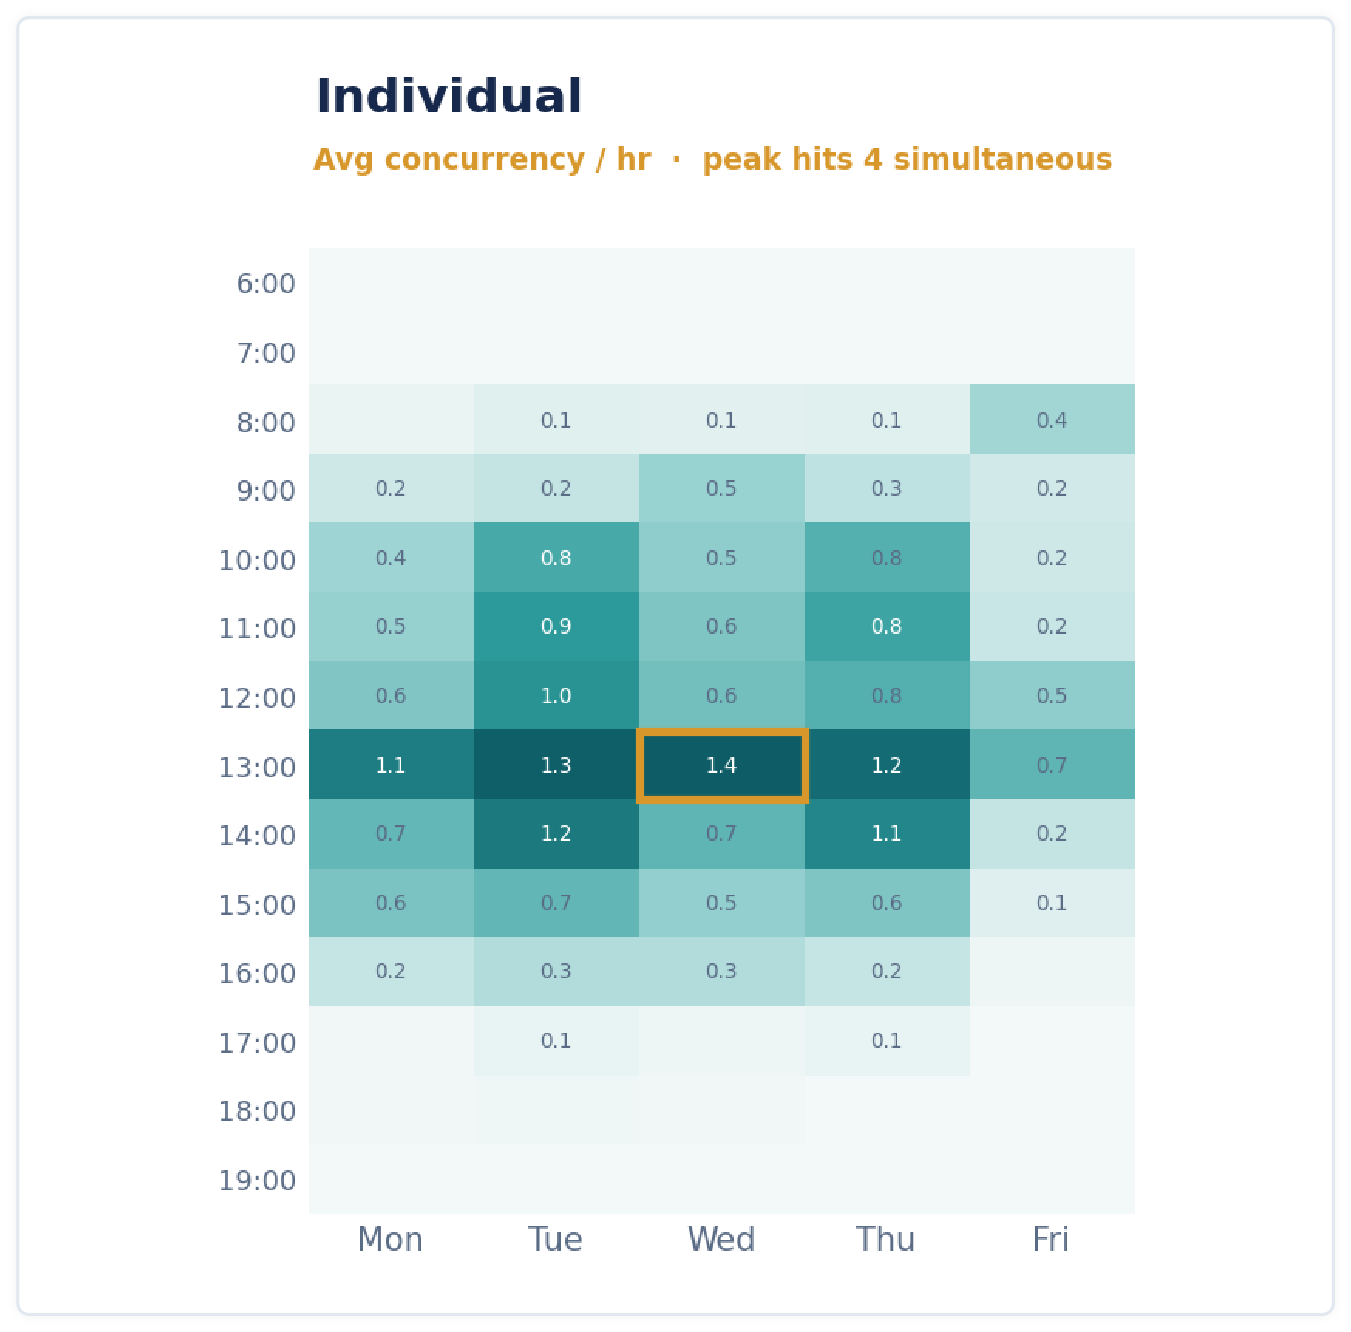
Individual offices and phone
Active profiles predict bookings. Demand peaks at midday and is lighter on Fridays, with peak concurrency of 4.
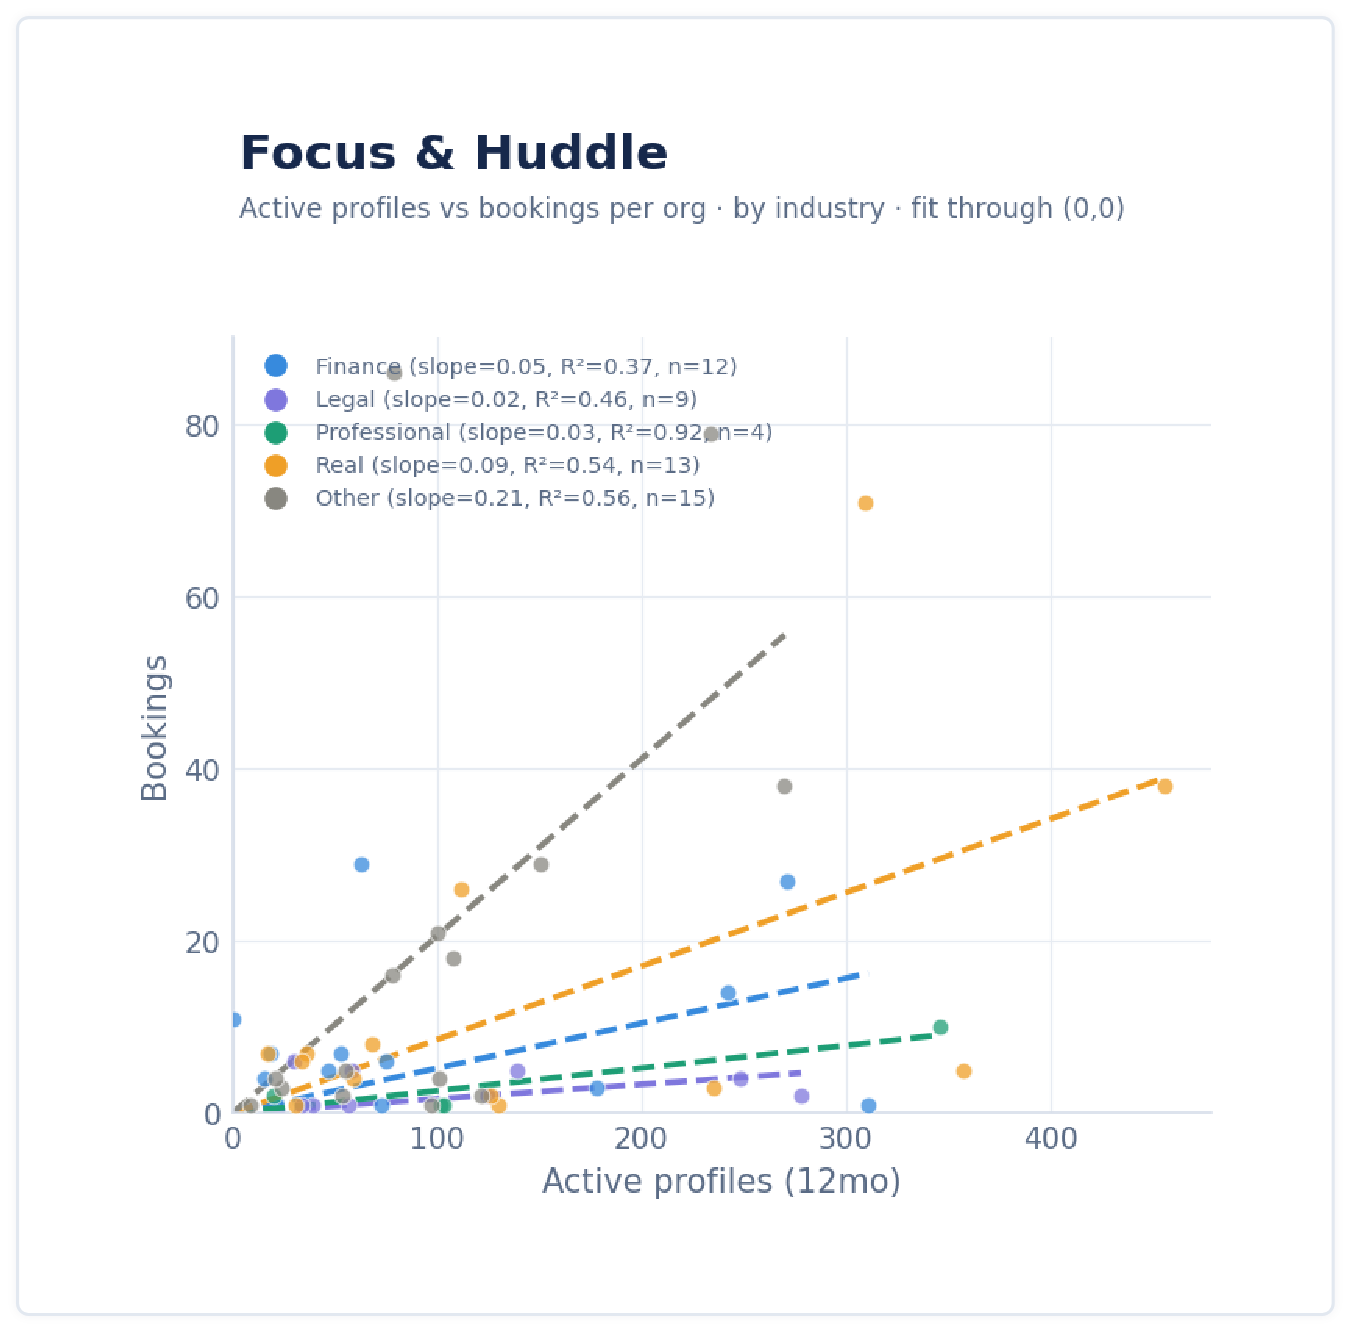
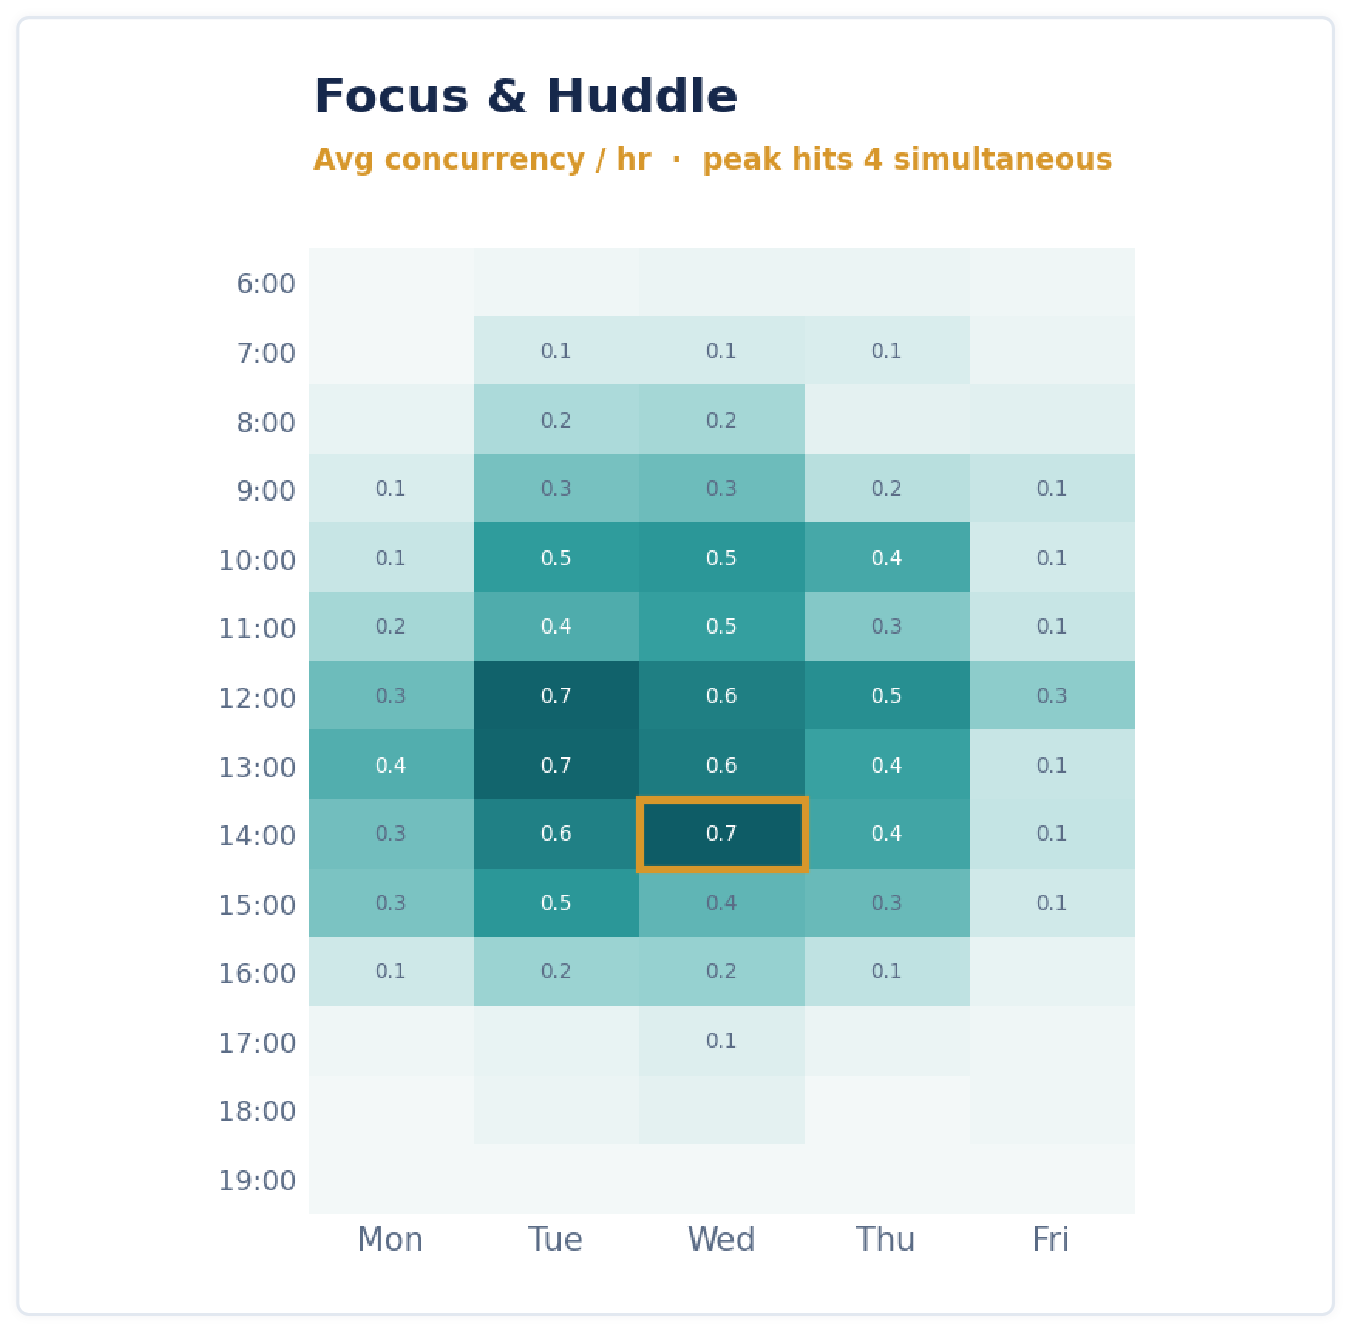
Focus & Huddle
Active profiles predict bookings. Demand builds through the afternoon, with peak concurrency of 4.
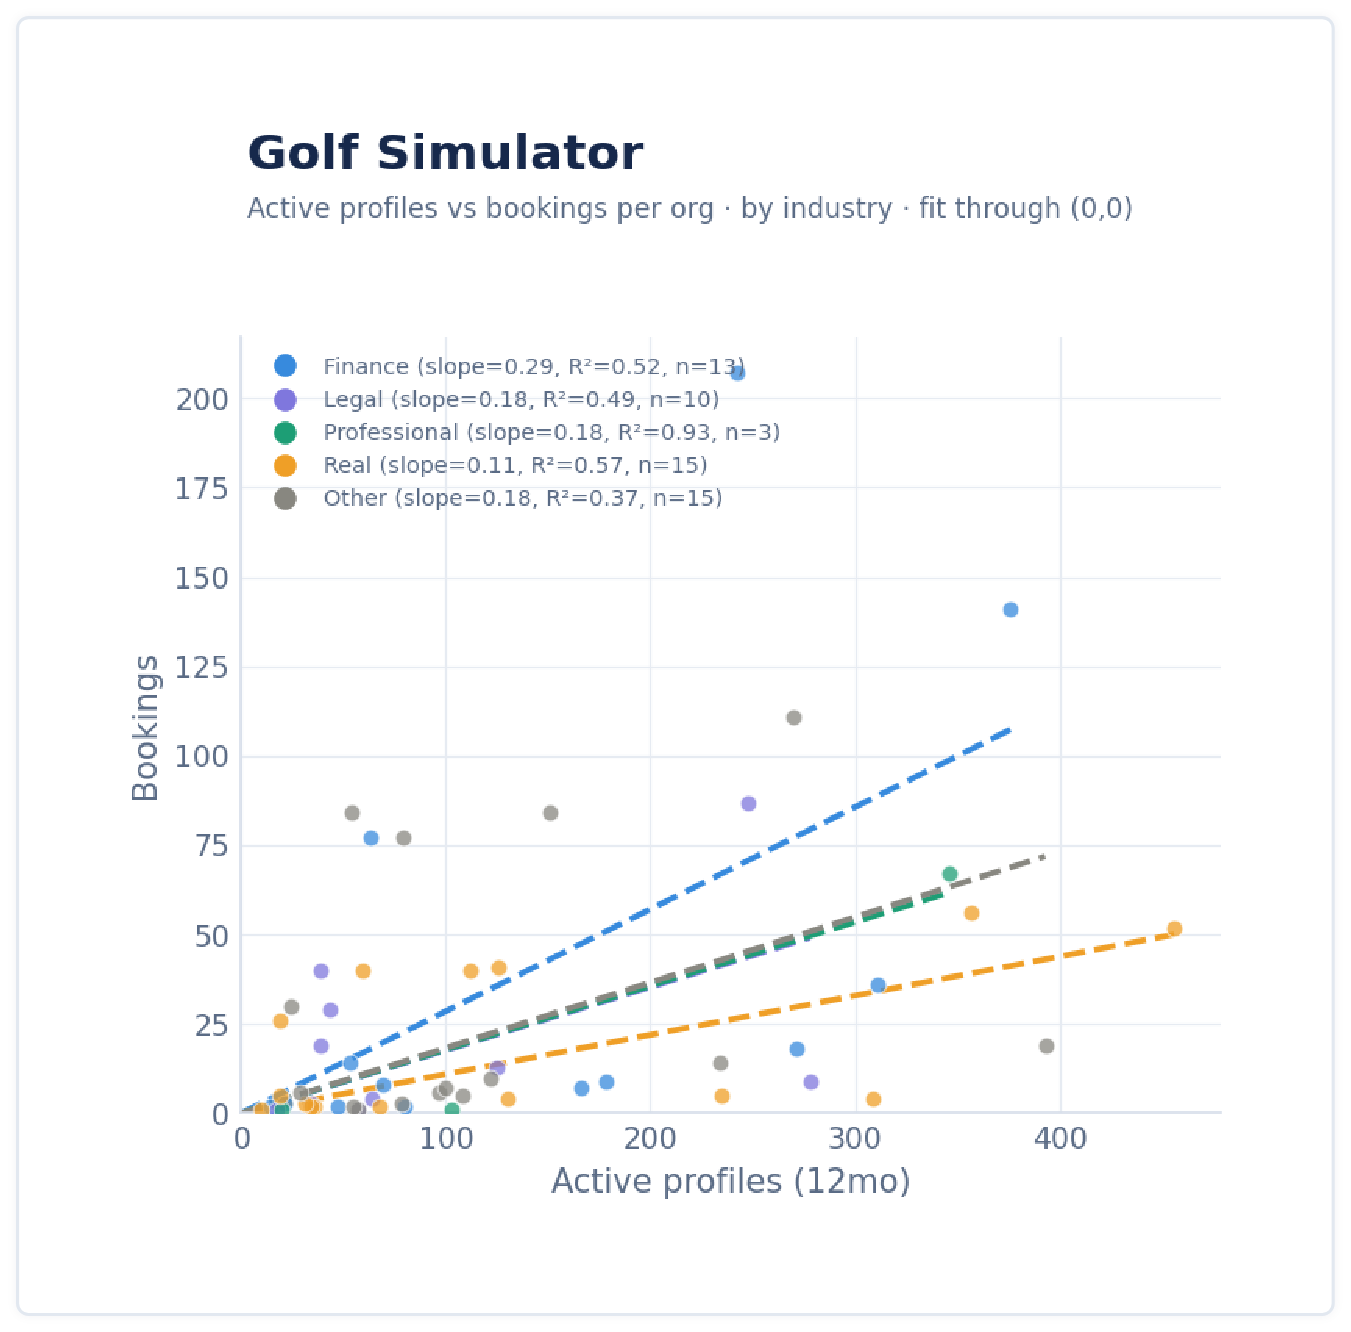
Golf Simulator: strongest signal
Strong active-profiles fit, with R² of 0.93 for Professional Services. Busy all afternoon into early evening, with peak concurrency of 3.
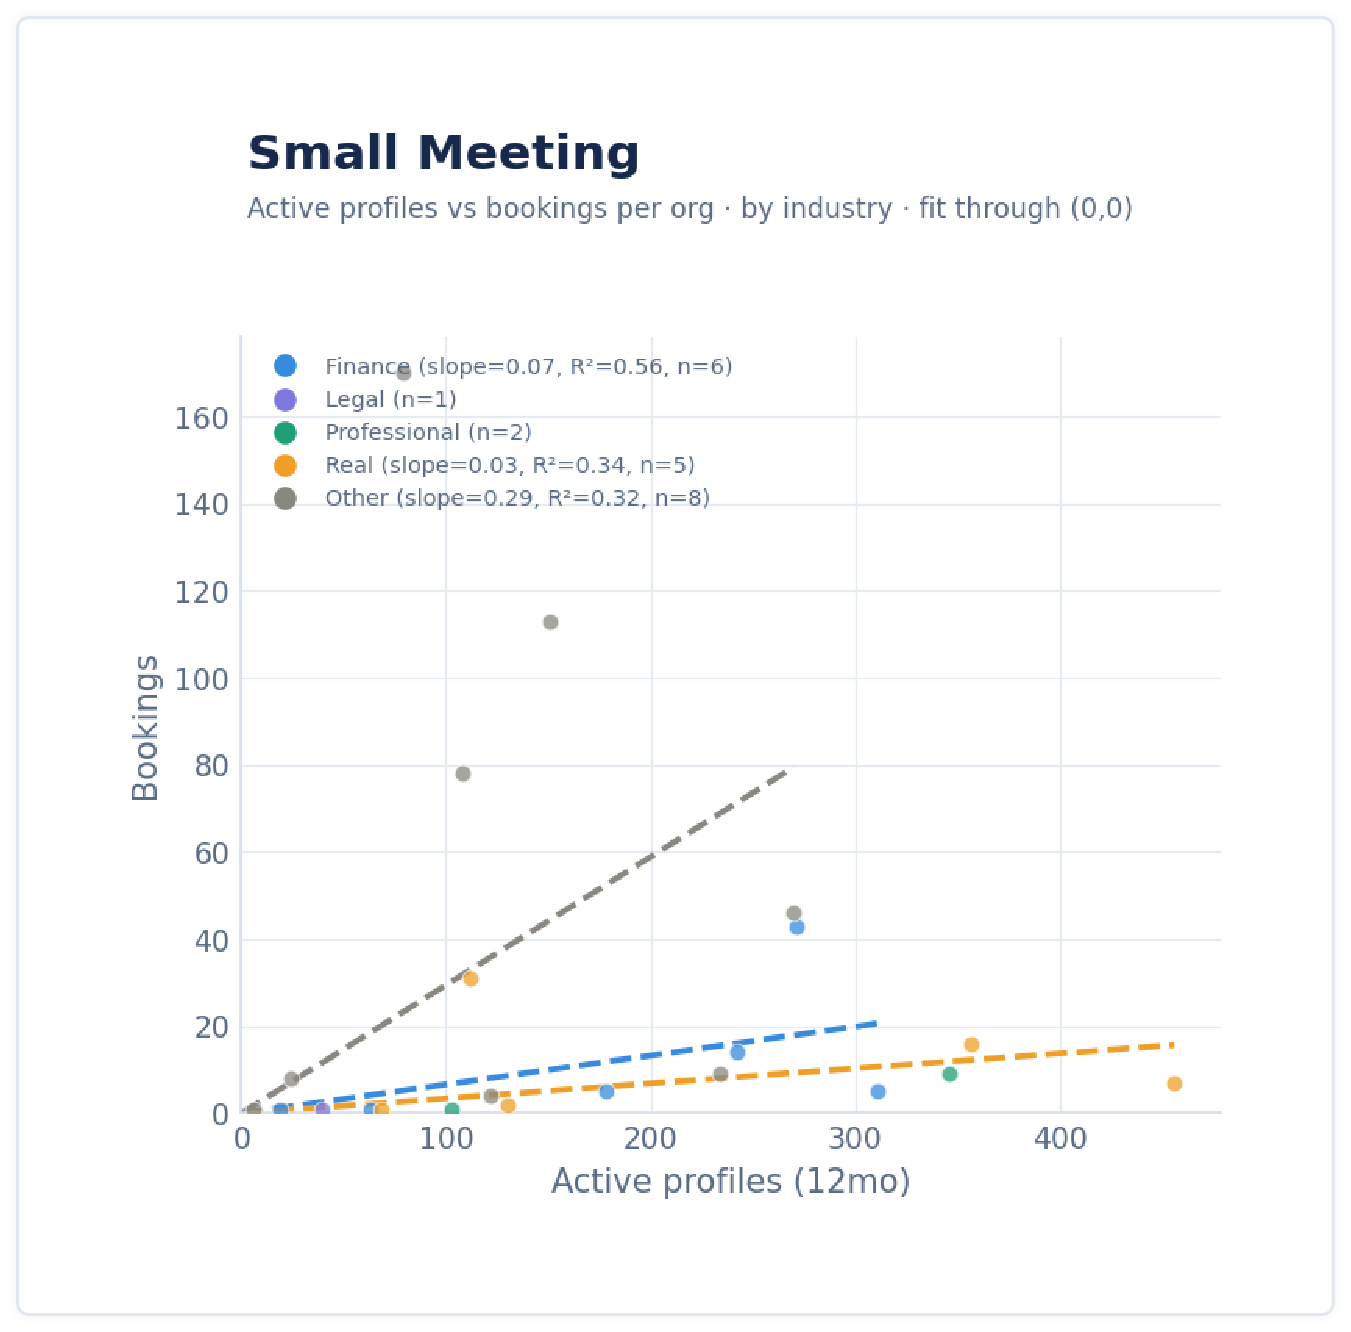
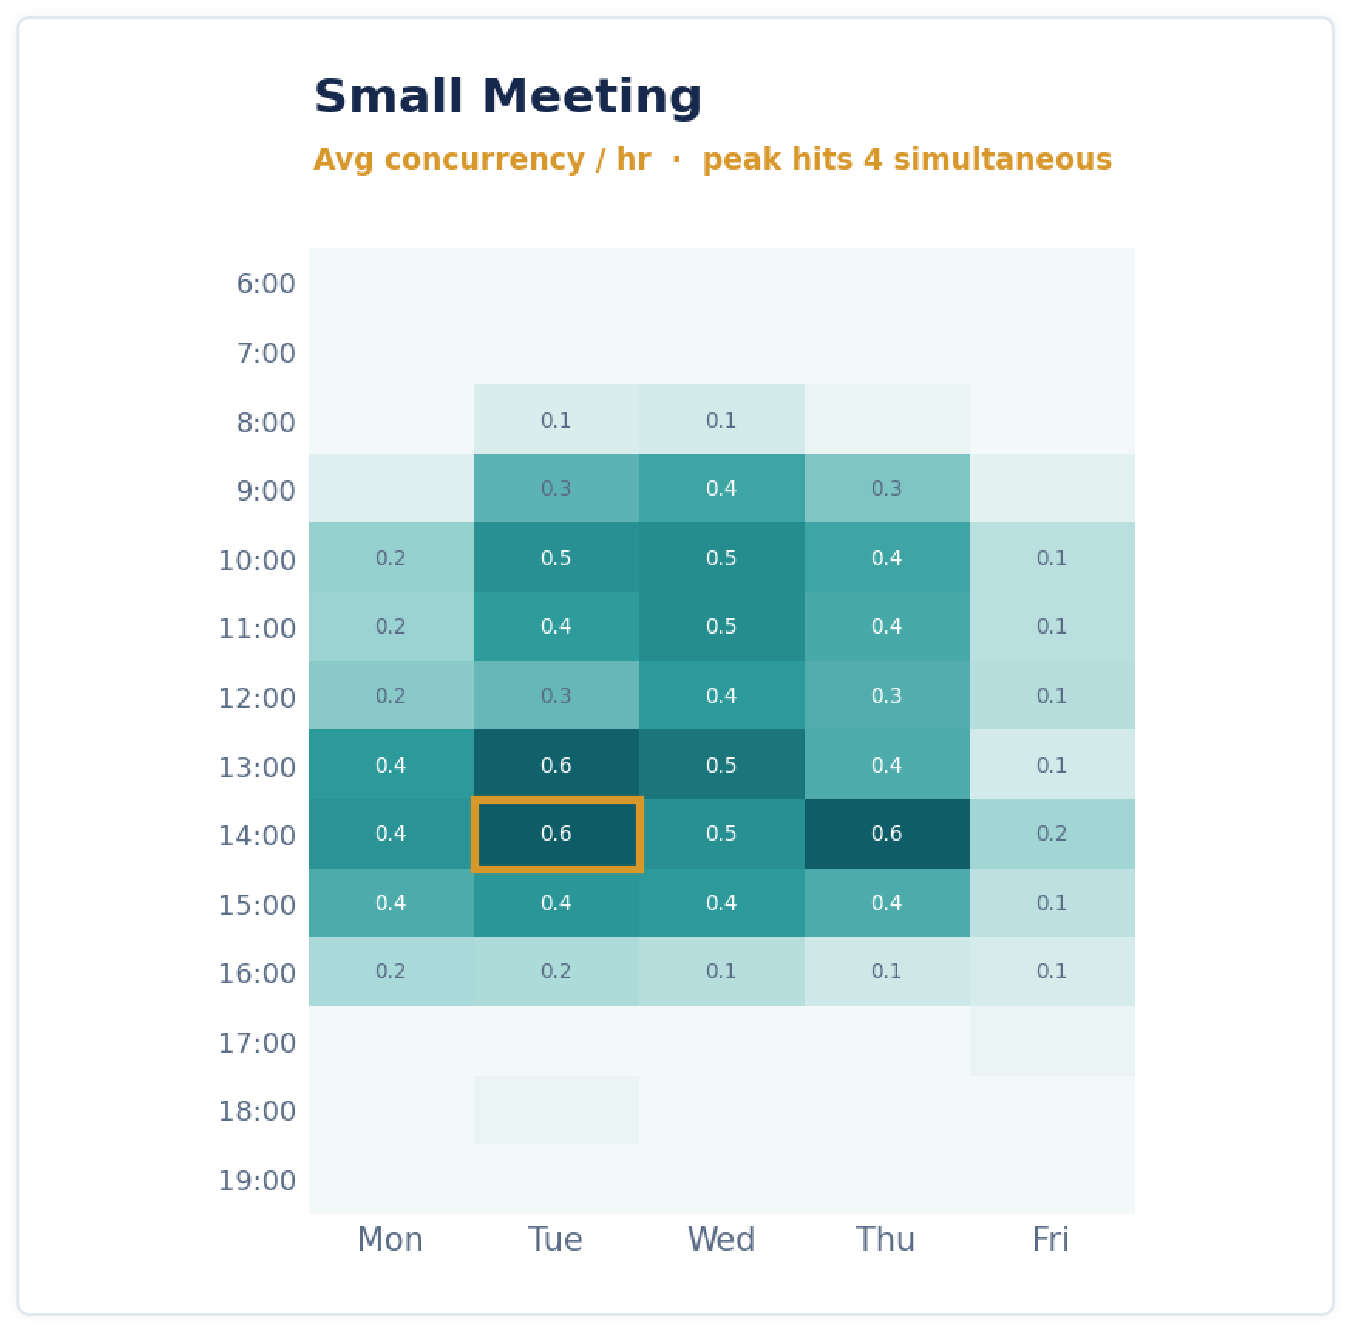
Small Meeting: highest demand ratio in the mix
Active profiles predict bookings. Steady afternoon demand, with peak concurrency of 4.
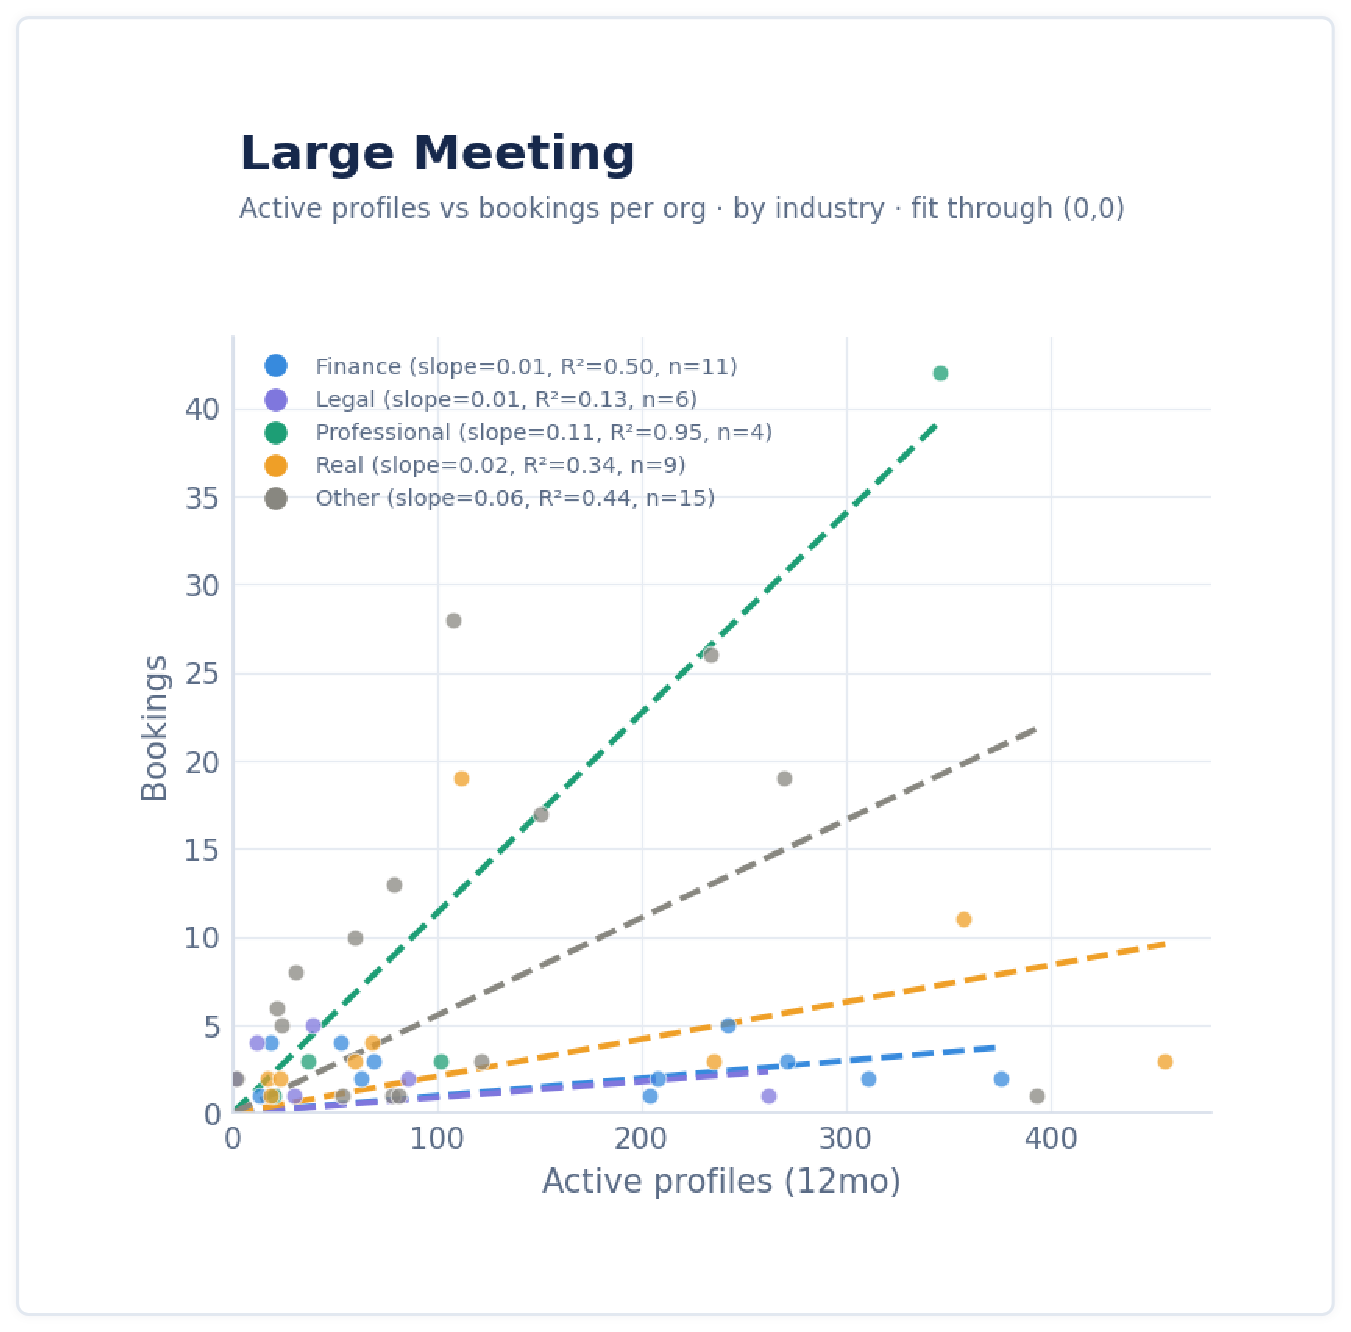
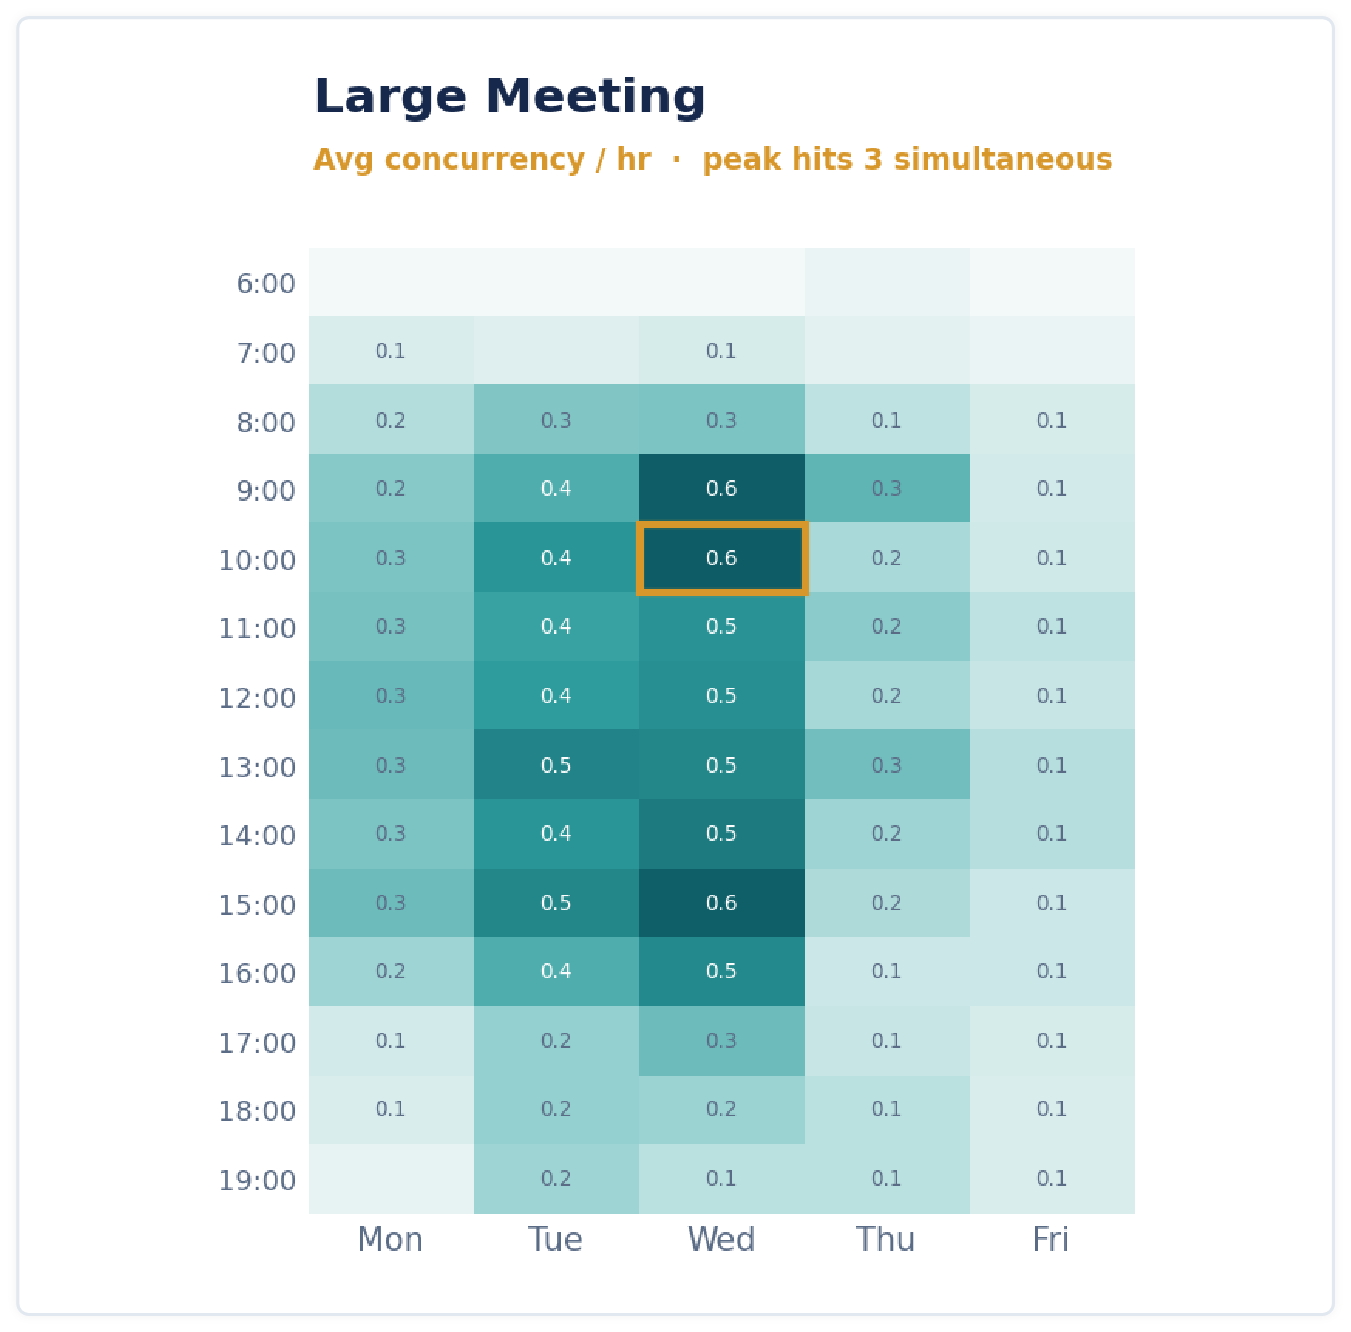
Large Meeting
Active profiles predict bookings. Demand is weighted to Tuesday and Wednesday with longer blocks, and peak concurrency of 3.
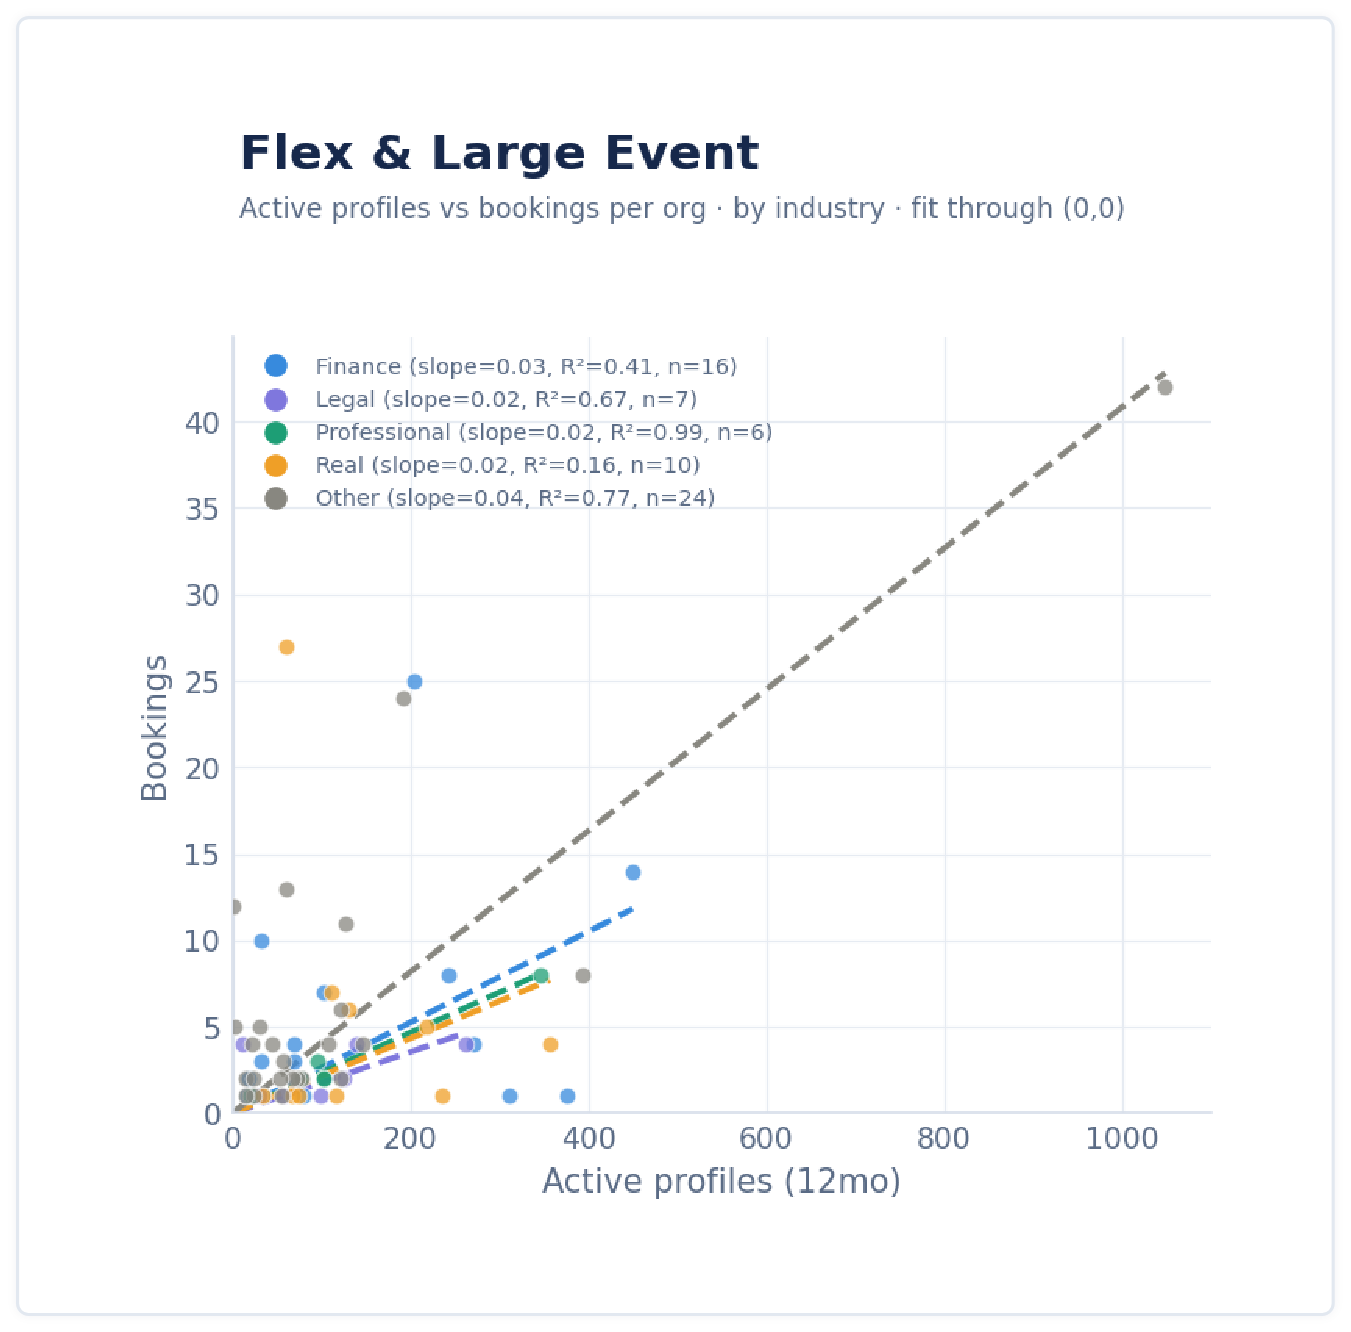
Flex & Large Event: longest sessions
Hardest to predict from headcount alone. Demand concentrates on Tuesday and Wednesday with long event blocks, and peak concurrency of 5.
Want to learn more about how we help teams measure Engagement and better understand retention? Reach out and let's chat.